Summary: To load you with some interesting factoids for cocktail party conversations and to provide background for the next couple of analytical posts — here are some highlights from the 2006 IRS data pile (the latest year available) , and the link to the complete IRS data set (which is a treasure trove of info).
Some Highlights
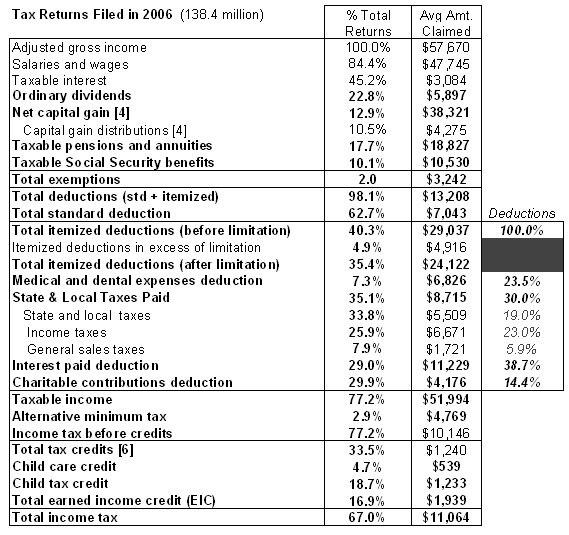
138.4 million returns filed … reporting almost $8 trillion in AGI
… up 8.4% from 2005 … $57,670 average AGI
23% reported dividend income … averaging $5,897
10.5% reported capital gains … averaging $4,275
63% took the standard deduction … averaging $7,043
37% itemized deductions … averaging $24,122
30% reported charitable deductions … totaling $173 billion
2.9% were assessed Alternative Minimum Tax
… averaging $4,769
19% claimed child tax credits … averaging $1,233
17% claimed earned income tax credits … averaging $1,939
67% paid income taxes … averaging $11,064
33% paid zero taxes (or received a refundable tax credit)
… up from 20% in 1990 and 25% in 2000
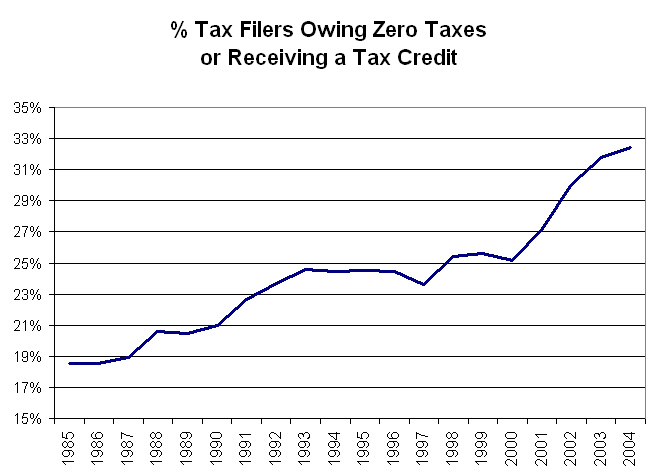
* A deeper dig on this point is coming in subsequent posts *
* * * * *
Summary Table:
Source: IRS
http://www.irs.gov/pub/irs-soi/06in01fg.xls
* * * * *
Next up: Taxpayers – A Dwindling Majority
* * * * *
Want more from the Homa Files?
Click link => The Homa Files Blog

July 28, 2008 at 9:34 am |
I’m curious to see what your conclusions will be. While this point may not figure into your analysis, keep in mind that the overall taxation picture changes significantly once you consider sales and payroll taxes.