Excerpted from McKinsey Quarterly, “Using ‘Power Curves’ to Assess Industry Dynamics”, by Michele Zanini, November, 2008
* * * * *
Major crises and downturns often produce shakeouts that redefine industry structures. However, these crises do not fundamentally change an underlying structural trend: the increasing inequality in the size and performance of large companies.
The past decade has seen the rise of many “mega-institutions”—companies of unprecedented scale and scope—that have steadily pulled away from their smaller competitors. What has received less attention is the striking degree of inequality in the size and performance of even the mega-institutions themselves.
Plotting the distribution of net income among the global top 150 corporations in 2005, for example, doesn’t yield a common bell curve, which would imply a relatively even spread of values around a mean. The result instead is a “power curve,” which, unlike normal distributions, implies that most companies are below average. Such a curve is characterized by a short “head,” comprising a small set of companies with extremely large incomes, and drops off quickly to a long “tail” of companies with a significantly smaller incomes.
* * * * *
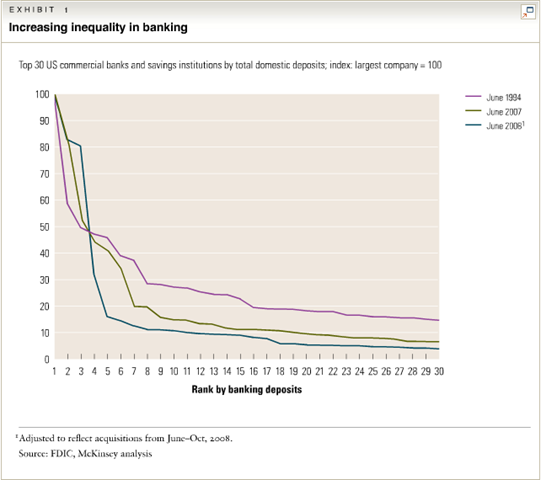
Exhibit 1 shows the top 30 US banks and savings institutions in June 1994, 2007, and 2008, measured by their domestic deposits. The exhibit shows that inequality has been increasing from 1994 (when the number-ten bank was roughly 30 percent of the size of the largest one) to 2008 (when it was only 10 percent as large as the first-ranked institution). It also shows how in 2008, the financial crisis accelerated the growth of the top five compared with the other banks in the top ten as the largest financial institutions took advantage of their relatively healthy balance sheets and absorbed banks in the next tier.

* * * * *
Power curves are also promoted by intangible assets—talent, networks, brands, and intellectual property—because they can drive increasing returns to scale, generate economies of scope, and help differentiate value propositions. Exhibit 2 shows a significant degree of inequality, across the board, in the size and performance of companies in a number of sectors we researched. But the more labor- or capital-intensive sectors, such as chemicals and machinery, have flatter curves than intangible-rich ones, such as software and biotech.

* * * * *
The fact that industry structures and outcomes appear to be distributed this way opens up an intriguing new field of research into the strategic implications. Notably, the extreme outcomes that characterize power curves suggest that strategic thrusts rather than incremental strategies are required to improve a company’s position significantly.
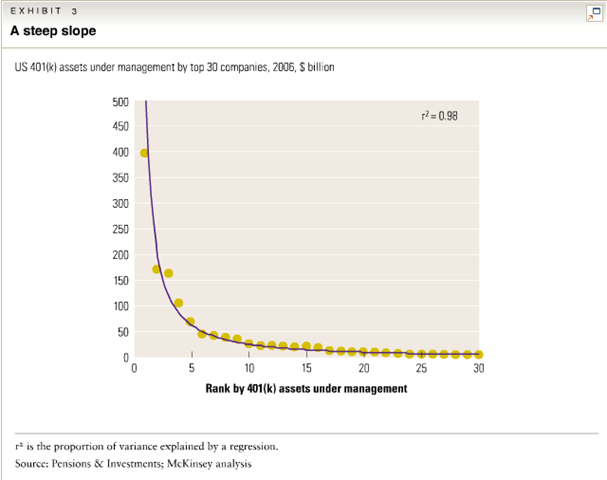
Consider the retail mutual-fund industry, for example. The major players sitting atop this power curve (Exhibit 3) have opportunities to extend their lead over smaller players by exploiting network effects, such as cross-selling individual retirement accounts (IRAs), to a large installed base of 401(k) plan holders as they roll over their assets. The financial crisis of 2008 may well boost this opportunity further as weakened financial institutions consider placing their asset-management units on the block to raise capital.

* * * * *
Unlike the laws of physics, power curves aren’t immutable. But their ubiquity and consistency suggest that companies are generally competing not only against one another but also against an industry structure that becomes progressively more unequal. For most companies, this possibility makes power curves an important piece of the strategic context. Senior executives must understand them and respect their implications.
Edit by DAF
* * * * *
Full article:
http://www.mckinseyquarterly.com/Strategy/Growth/Using_power_curves_to_assess_industry_dynamics_2222
* * * * *
Want more from the Homa Files?
Click link => The Homa Files Blog
* * * * *
SHARE THIS POST WITH FRIENDS & FAMILY


