This was a week that market analysts retroactively tag “a long anticipated correction”.
Yeah, right. That’s what you guys have been saying.
====
This week’s market dynamics beg a bigger question:
Why, given a sluggish economy and DC disarray, did the stock market keep marching forward to record highs … that met their come-uppance this week?
Easy.
Let’s start by taking a stroll down memory lane ….
Back about 40 years ago, an economist-wannabe co-authored a study in the Journal of Finance titled “The Supply of Money and Common Stock Prices”.

The article summarized an econometric study that demonstrated a tight link between the amount of money floating around and, on a slightly time-delayed basis, the price of stocks.
OK, fast forward to today.
Now, when the Feds expand the money supply, it’s called “Quantitative Easing” … or QE, for short.
Recently, Jason Trennert of Strategas Research Partners published a revealing chart that visually relates stock prices (the S&P 500) to the recent periods of quantitative easing.
Hmmm.
Looks like the supply of money and common stock prices are still related.
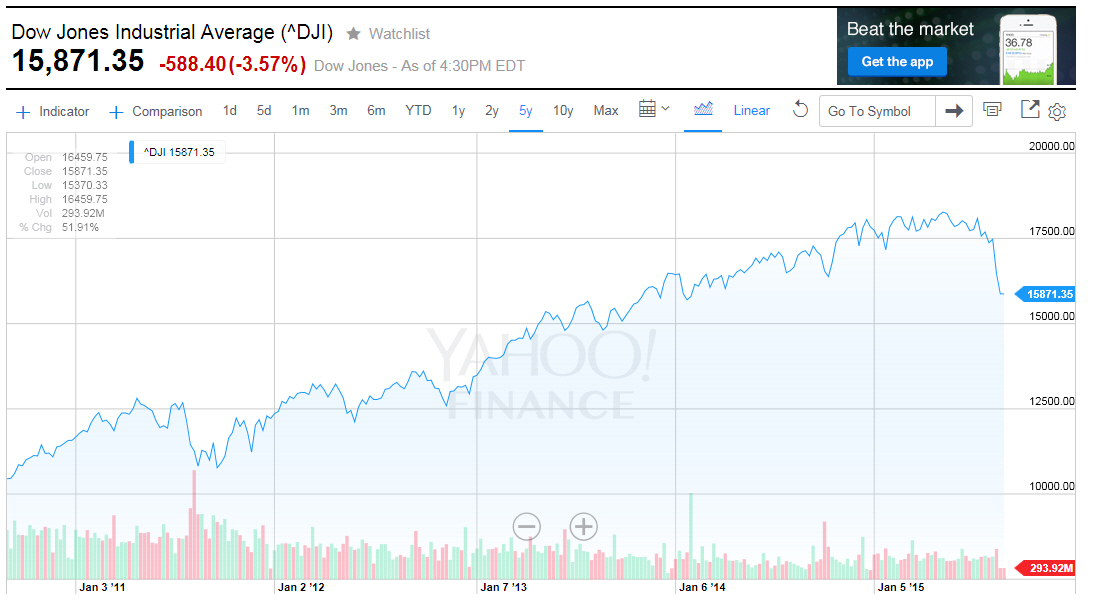
Partially explains why the Dow is near 16,000 despite a sluggish and uncertain economy.


Leave a comment