Archive for the ‘Stock Market’ Category

Viva la Gridlock!

November 11, 2022

The stock market soared yesterday because…
==============

First, the numbers…

Yesterday, the stock market soared … the S&P was up 5.54% to 3,956.

image

Let’s put that number in perspective…

The S&P at 3,956 is:

  • 3% higher than when Biden was inaugurated (01/20/21 S&P = 3,841)
  • 17% lower than the sugar-high market peak (12/27/21 S&P = 4,766)
  • 11% higher than the Biden era market trough (10/12/22 S&P = 3,577)

To summarize, the market today is about where it was when Biden was inaugurated … has recovered about 1/3 of the 25% peak to trough decline … and is up 11% from the trough.

So, you can either feel bad (still down 17% from the peak) … or good (recovered about 1/3 of the peak to trough decline).

=============

For today, let’s focus on the positive … yesterday’s bounce … and ask “why?”

There were 2 near-simultaneous events yesterday morning.

  1. The reported inflation rate for October was down to 7.7%
  2. Media vote counting arbiters conceded that the GOP was on track to gain control of the Congress.

image

My take:

The 7.7% is statistically insignificant from the recent inflation running rate … it’s likely month-to-month noise … and likely driven by a decline in residential housing prices … which is, perhaps, a blessing for renters, but a curse to homeowners (whose home is a big chunk of their net worth).

So, I don’t place much weight on the 7.7% inflation rate driving the market gain.

=============

I think the market gain was driven by the near certainty that the GOP will control Congress and we’ll have split government gridlock for the next 2 years … and, at least, an end to reckless government spending.

Here’s hoping…

So, why is the stock market doing so well?

May 9, 2020

WSJ says there are 5 reasons.
=============

This is an awkward post to write.

As much of the country is struggling to pay the rent and put food on the table, today I’m channeling a WSJ explanatory on why the stock market is doing as well as it is (down 9% from Feb. high, but up 30% from March low)

image

Putting my legacy of Catholic guilt aside… The WSJ offers 5 reasons:

  1. Counting on a quick economic rebound
  2. Big tech stocks are doing well during the crisis
  3. Optimism high for corporate earnings in 2021
  4. Rear of missing the upside
  5. The Fed is printing money.

Here are some supporting details & tidbits…

(more…)

Happy New Year !

January 2, 2020

2019 summarized in 1 chart

==============

OK, call me a single issue voter if you want, but…

The S&P closed at 3,230.78.

image

That puts the S&P up about 34% from the markets Xmas 2018 “correction” when the Fed tried to inch up interest rates.

Breaking that down…

It took the market about 7 months to rebound about 24% and get back to the pre-correction high.  (See the green dotted line above).

Then, the market tacked on another 10% in the back half of 2019.

And, the market still seems to have some steam for 2020.

I wouldn’t mind another 34%.

=============

Follow on Twitter @KenHoma

>> Latest Posts

#HomaFiles

Brokerage firms leveraging the “compelling power of free”…

October 8, 2019

I oft preached in class about the “compelling power of free”.

image

Consumers just can’t resist free stuff … whether they need it or not.

So, “free” is consistently reported to be the most powerful word in advertising. It draws attention … and provokes action.

And, in terms of market response, there’s a big difference between “free” and “almost free”…

(more…)

Market: Mr. Toad’s Wild Ride … butterflies, head fakes & accelerants.

August 31, 2015

It was an interesting week on Wall Street … a huge drop on Monday …  followed by 3 days of high intra-day volatility … and ending right about where things started.

Whew.

So, what happened?

image

For what it’s worth, here’s my take …

(more…)

Why did the stock market get over valued?

August 28, 2015

This was a week that market analysts retroactively tag “a long anticipated correction”.

Yeah, right.  That’s what you guys have been saying.

DJIA 08-24-15 5 years
====
This week’s market dynamics beg a bigger question:

Why, given a sluggish economy and DC disarray, did the stock market keep marching forward to record highs … that met their come-uppance this week?

Easy.

Let’s start by taking a stroll down memory lane ….

(more…)

TechView: The 2 market charts that I’m watching …

August 26, 2015

I don’t give investment advice.  Period.

That said, there are the 2 technical charts that I have on my radar.

The first is a simple “channeled” trend view of the S&P 500

image

The takeaway:

For the past 3-1/2 years, the S&P has been trending upward (no news there) … within a fairly constant band delimited by the highs and lows.

Besides being a psychological trigger, the 2000 level appears to have been a significant technical breakpoint.

Hindsight is 20/20 … I should have bailed on my S&P Index holdings when the 200 level was broken.

But, of course, I didn’t.

Ouch.

The 2nd chart zooms in on the last 5 days of trading.


(more…)

Bernie Sanders missed a big opportunity on Monday …

August 26, 2015

Yesterday, we posted about high frequency traders crowing about their high profits from Monday’s unprecedented stock market volatility.

Arguably, their methodology — hinging on fast data and low transactions’ costs — fanned the volatility flames.

I was surprised that Bernie Sanders didn’t seize the moment to say “I told you so” … and to pitch his Financial Transactions Tax.

Given the stock market bounces this week, I though it would be timely to reprise a post from a couple of weeks ago which has heightened relevance and timeliness …

=====

Shocker: I agree with Bernie Sanders’ Financial Transactions Tax … err. make that “half-agree”

Dem-Socialist candidate Bernie Sanders doesn’t serve up much that I agree with … but, there is one reheated idea that I half-support.

Sanders proposes that financial transactions be taxed … roughly 1/2% for most trades … slightly lower for for some categories of investments … say, Municipal Bonds.

Sanders would use the new tax proceeds to fund public college for low-income students.

image

=====

Let’s dissect the proposal … then, for what it’s worth, I’ll tell you where I agree and where I disagree …

(more…)

High frequency traders crow: “Best day since the 2010 Flash Crash” … say what?

August 25, 2015

Yesterday was a historically spectacular day on Wall Street … DJIA down 1,000 on the open, rebound by about 750 points, back down by 750.

Unprecedented volatility.

DJIA 08-24-15

Geez, was the world’s economic structure changing that much hour-to-hour?

Was new economic  information flowing in at warp speed?

Nope.

Sure, there was a deepening understanding that the market is over-valued and that China’s economy is in trouble.

That explains a big correction, but what about the hour to hour volatility?

(more…)

Shocker: I agree with Bernie Sanders’ Financial Transactions Tax … err. make that “half-agree”

July 22, 2015

Dem-Socialist candidate Bernie Sanders doesn’t serve up much that I agree with … but, there is one reheated idea that I half-support.

Sanders proposes that financial transactions be taxed … roughly 1/2% for most trades … slightly lower for for some categories of investments … say, Municipal Bonds.

Sanders would use the new tax proceeds to fund public college for low-income students.

image

=====

Let’s dissect the proposal … then, for what it’s worth, I’ll tell you where I agree and where I disagree …

(more…)

The state of the economy in 2 charts …

October 8, 2014

Earlier this week, we looked at one of the no-BS economic measures: household income.

Adjusted for inflation, median household income dropped 8% during the recession … and has been flat after bottoming out a couple of years ago.

That means that the median real household income is still down 8% from the pre-recession peak.


======

The drop in median household income has come despite a steady increase in average hourly wages … they’re up about 10% since the official end of the recession.

See Let’s celebrate the economy … err, let’s wait. for details

Here’s another no-BS indicator sent along by a loyal reader …

(more…)

Uh-oh: Smart money, dumb money …

December 6, 2013

Interesting chart from B of A – Merrill Lynch posted on Business Insider


image

=====

Bottom line: Smart money is getting out of the stock market at an increasing rate … dumb (err, “individual”) money is trending back in.

And, the hedgers are, well, hedging.

Caveat investor.

* * * * *
Follow on Twitter @KenHoma              >> Latest Posts

Why does the stock market hit record highs despite a sluggish economy?

November 15, 2013

Yesterday, the stock market soared to a new high, again.

image

====

Why, given a sluggish economy and DC disarray, is the stock market still moving higher??

Easy.

Let’s start by taking a stroll down memory lane ….

(more…)

Why did the stock market hit record highs despite a sluggish economy?

September 19, 2013

Yesterday, the stock market soared when Bernanke announced the continuation of the Fed’s Quantitative Easing program … that is, the Fed plans to continue pumping $85 billion dollars per month into the economy.

stocks surge on Fed action

====

So, why did the market reach record highs?

Easy.

Let’s start by taking a stroll down memory lane ….

(more…)

$$$: Time to move to cash?

September 5, 2013

First, the disclaimers:

1) I don’t give investment advice.

2) I think Jim Cramer is a blowhard.

But …

image

Last week, a friend of mine who seems to have a touch reading the market alerted me that he was moving strongly towards cash … away from stocks … and far away from bonds.

Hmmm.

Cramer must have been listening in.

Here are Cramer’s 7 reasons to move to cash …

(more…)

Why the Fed’s QE isn’t booming the economy …

July 24, 2013

Two related articles caught my eye …

First, the Washington Post editorialized that:

The only part of the Obama economy that has flourished  is Wall Street.

Only the trickle-down from the wealthy financial players, who have thrived off the conveyor belt of money as it travels from Washington to Wall Street, has had much of a positive effect on the economy as a whole.

Let’s break down the economic fundamentals.

First, a chart showing the “conveyor belt of money” …

image


Note that the M1 money supply increased from about $1..4 trillion in 2009 to today’s $2.6 trillion.

Shouldn’t a cool $1.2 trillion more in supply of money get the economy cranking into overdrive?

Here’s the rest of the story …

(more…)

Nums: What % of stocks actually create shareholder wealth?

March 29, 2013

We’re talking higher long-run capitalizations, not trading profits.

Over the period 1983 to 2007, the S&P increased more than 7-fold. but …

image

According to Longboard Asset Management, over the period 1983 to 2007:

  • 40% of stocks lost value
  • 19% lost at least three-quarters of their value
  • 64% underperformed the market
  • 25% were responsible for all the market’s gains.

Conclusion: Statistically, successful stock-picking is more about avoiding awful investments than finding good ones.

= = = = =

P.S. Tell me that you can look at the last 15 years on the above chart and not feel a little queasy about where the market is these days.

It sure looks like a pattern to me …

* * * * *
Follow on Twitter @KenHoma          >> Latest Posts

Despite record high Dow … I’m still a bear.

March 6, 2013

Yesterday was a day of stock market joy … the Dow hit a new high water mark.

Since halving itself during the financial crisis, the market has more than doubled … recouping its losses … and more.

But, what about the the technical factors … just reading the charts.

Yesterday, we posted the red section below … and asked the question: see the pattern?

To me, looks like we’re approaching a cyclical peak.

image

Today, look at the black line … and the trend line that I’ve added.

The chart deflates the S&P 500 … adjusting for inflation.

Hmmm.

Looks like the real value of the S&P 500 has been trending down for the past 15 years or so.

Think we’ll defy the trend line and keep heading up?

I’m betting the under.

* * * * * ?

Disclaimers:

  1. I don’t give investment advice … I just observe stuff.
  2. I’m on record having predicted a significant market drop during Obama’s 2nd term

I’m still holding my ground.

* * * * *
Follow on Twitter @KenHoma            >> Latest Posts

Charts: Anybody see a pattern here?

March 5, 2013

OK, let’s role play.

You’re in a job interview or taking the GMAT or chatting with a shrink.

You’re presented with the following chart and asked to etch out the next couple of moves.

What’s your play?

image

Answer’s pretty clear right?

Looks like a recurring cycle that’s about to turn down.

Here’s the “so what?”

(more…)

GDP down, unemployment claims up, unemployment rate up, Dow heads for record high … say, what?

February 2, 2013

Many folks are wondering: Why has the stock market continued to steam ahead despite a ho-hum (or humbug) economy?

image
Source: Council of Economic Advisers

Answer: It’s less a matter of optimism re: a recovery, and more a function of the Fed pouring money into the economy.  You know, quantitative easing — QE-infinity.

Here’s why …

(more…)

By one metric, household net worth is running at historical levels …

November 30, 2012

Interesting analysis by the CBO

Punch line:  When you delate the numbers, i.e. take out inflation effects – household net worth is roughly 5 times disposable income … that’s down from the dot-com and housing booms & busts, but roughly at historical levels.

In other words, the market bubbles were more like sugar-rush outliers … than “new normals”.

image

* * * * *
Follow on Twitter @KenHoma

Stock market: This year, beware the Ides of December …

November 19, 2012

The stock market usually does well in December: gaining ground in 75% of Decembers since 1928 while earning a 1.5% average monthly return … second best of the 12 months .

But , as we’ve harped before …

Capital gains taxes are scheduled to rise at the start of 2013 from a 15% rate to 23.8% (20% plus a 3.8% tax associated with ObamaCare.

image
Source

According to Goldman Sachs:

The nearly 9 pp hike in capital gains taxes is similar in magnitude to the 9 pp rise in 1970 and the 8 pp rise in 1987.

In both prior cases S&P 500 posted negative returns in December as investors locked-in the lower tax rate.

The S&P 500 fell by 1.9% in December 1969 and 2.8% in December 1986.

Merry Christmas!

* * * * *

Unemployment claims and the stock market … interesting !

November 14, 2012

Not to worry, not another rant against the curious BLS reporting.

Business Insider posted an interesting analysis by GSAM Chairman Jim O’Neill, mapping the inverse of initial unemployment claims with the S&P 500.

First, it’s pretty clear that the series track closely.

Moreover, O’Neill observes:

”it’s worth noting the last time there was a severe break between the two lines was [Summer 2011], around the debt ceiling fight, a scenario which the current fiscal cliff debate harkens back to. Then the market freaked out, but mostly the economy kept on rolling.”

In other words, the economy is improving, albeit slowly, and last week’s drop was related to the election … but it’s not “Obama elected, market tanks” … it’s “Will divided government gridlock or avert the Fiscal Cliff?”

So, if the fiscal cliff gets resolved, then following O’Neill’s logic … the market goes up.


image

Where’s the stock market heading?

November 12, 2012

Couple of friends have told me that I’m way too pessimistic thinking that the Dow will go to about 8,000 since Obama got re-elected.

Maybe so, but how about an S&P 500 down to 800?

Glance at the below short-run and longer-run charts.

What do you think?

image


image

Could be worse … you could be a coalminer.

November 8, 2012

Not only to you make a living busting your butt and breathing coal dust, but the Feds are trying to put you out of business.

Or, you could be a mining company or one of its shareholders.

Overall market was down 2.3% yesterday – the day after the election.

Coal stocks dived 5.5%

Ouch.

image

Why the stock market is still hanging on …

October 15, 2012

The economy is sluggish, corporate guidance has turned a bit bearish, but the stock market is still at high levels.

What’s up?

Well, broadly speaking, it’s the QE3 effect – the Fed is flooding the marketing with money again, keeping interest rates low.

Remember the low interest rates may be good for borrowers, but are awful for investors looking for more-or-less fixed incomes with some modicum of security.

More specifically, starting in 2011, benchmark Treasury rates (e.g the 5-year T-Bond) have been below the broad market dividend yield – represented by the S&P 500 Dividend yield’.

image

* * * * *
And, the spread has been widening recently – in favor of stock dividends

image

* * * * *
Bottom line: money flows to the best returns … it’s basic finance.

Thanks to SMH for feeding the lead

>> Latest Posts

Why has the stock market has been strong despite a weak economy?

August 14, 2012

Back about 40 years ago, an economist-wannabe co-authored a study in the Journal of Finance titled “The Supply of Money and Common Stock Prices”.

image

The article summarized an econometric study that demonstrated a tight link between the amount of money floating around and, on a slightly time-delayed basis, the price of stocks.

OK, fast forward to today.

Now, when the Feds expand the money supply, it’s called “Quantitative Easing” … or QE, for short.

Recently, Jason Trennert of Strategas Research Partners published a revealing chart that visually relates stock prices (the S&P 500) to the recent periods of quantitative easing.

Hmmm.

Looks like the supply of money and common stock prices are still related.

Partially explains why the Dow is over 13,000 despite a sluggish and uncertain economy.

image

>> Latest Posts

My GE roller-coaster … the Immelt appointment.

January 25, 2011

OK, the stock got a bump on Friday thanks to a sweet earnings report … and, perhaps, thanks to Obama naming CEO Immelt to head up his recovery board of advisers.

I’m conflicted, for a couple of reasons.

First,  GE stock  has steadily lost value during Immelt’s tenure … which started in 2001.

image

Yeah, there was 9/11 and the financial crisis, but the rest of the world – measured by the S&P 500 has pretty much gotten back its losses. 

 GE is still down 50% from when Immelt took over.

But, it makes you wonder: why didn’t Obama pick a CEO with a record of success?

Say, like Immelt’s predecessor –- Jack Welch – who knows how to cut costs and drive innovation.

I guess Obama wanted somebody he could count on to support his healthcare and cap & trade initiatives.

FoxNews has taken to calling GE “Government Electric”  because it yapped the TARP program, it takes a heavy dose of government contracts, and its media outlets (NBC and MSNBC) cheerlead for Obama..

There are a few companies on the Obama corporate A List – Democratic patrons Google and Goldman Sachs both turn up again and again at White House functions and for special recognition – but no company seems to get the VIP treatment that General Electric receives.

While most corporate leaders have taken a wait and see approach to Obama’s occasional overtures to the private sector, G.E., along with Google, Goldman and few others, have backed him to the hilt.

Whether it is pushing the president’s plan for global warming fees in order to create demand for his “Ecomagination” line of windmills, solar panels, etc., boosting the president’s national health-care law as part of an effort to sell more medical equipment, or enthusing over the Obama strategy of making loans available for industrial exporters, Immelt has been an Obama stalwart all along.

Immelt has also consistently argued to shareholders that there is big money to be made in advancing the Democratic agenda, in huge government contracts,   subsidies and incentives.

FoxNews.com, Obama Teams Up With GE, January 21, 2011

That raises some major angst for me – my political philosophy is on one side, and my wallet is on the other.

Oh my.

My GE roller-coaster ride … part 1.

January 24, 2011

First, the disclaimer: I own a statistically significant amount of GE stock – leftover from my years working with the company.  So, I’m as biased as biased can be.  I’d like the stock price to go up —  a lot.

* * * * *

I was bummed a week ago when the crack Sanford C. Bernstein analysts downgraded General Electric stock from an “outperform” rating to a “market perform” rating. As near as I can tell, in analyst-speak, that means “sell”.

I assumed that those dudes were plugged in and were foreshadowing a bad earnings report.

Then, the headlines started rolling in: G.E. Profit Rises 51%, Topping Forecasts … and the stock bumped more than 5% in a day.

image

Remind me not to listen to Sanford C. Bernstein analysts … boy, they must feel dumb … but, I bet they’ll still get fat bonuses.

* * * *

Tomorrow: Obama appoints Immelt to his recovery board …

The “Apple Effect” … What if Apple stock stalls? … or slides?

January 18, 2011

Steve Jobs’ announced leave of absence reminded me of a chat I had with one of my sons a couple of weeks ago.  He casually observed that Apple stock seemed to be the common denominator across mutual funds that were beating the market averages.

Point 1:  Apple stock is up nearly 80% since last February — and more than 400% since its 2009 low —the stock has single-handedly guaranteed that my portfolio has outperformed the major averages.

Point 2: A whopping 71% of Apple’s stock is owned by institutions.  That compares to 52% for GE and 49% for Exxon Mobil.  Fidelity & Vanguard own almost 10% of Apple’s stock.  Five institutions – adding State Street, TRP and Blackrock – push the number to almost 20%.

Point 3: For some big funds, Apple is a huge part of total holdings: it’s almost 12% of Janus 20 and almost 7% of Fidelity’s Contrafund.

Raises a couple of interesting questions:

1) How much of the market run-up the past year or so can be attributed to Apple – directly or indirectly?  It has to be statistically significant.

2) What happens if the funds that have ridden Apple’s stock rise decide it’s time to cash out?

Given the concentration among a few big hitters, things could  interesting …

Data from Yahoo Finance 

image 

image

The problem with growth stocks …

January 12, 2011

No idea whether the body of research supports the conclusion, but the article caught my attention …

* * * * *

The history of the stock market is not kind to investors who chase growth stocks.

Over the long haul, study after study has shown that so-called growth stocks tend, on average, to fare poorly. For each winning stock, there are many costly losers.

Indeed, some analyses argue that investors have typically done better investing in the beaten-down stocks that everyone hates than they have in the glamorous ones everyone loves.

That’s because unloved stocks tend to be so cheap, and expectations so low, that positive surprises can come quite easily.

With go-go glamour stocks, the reverse is true. Even a single disappointment can get punished severely.

WSJ, Is This the Peak for Netflix?, Dec. 24, 2010
http://online.wsj.com/article/SB10001424052748703548604576037920087686958.html?mod=WSJ_hp_mostpop_read

Dow’s up … but not as much as the rest of the market.

December 1, 2010

Punch line: The Dow 30 is up almost 10% in 2010.  But, for the past year, the Dow 30 stocks have been under-performing relative to all other stocks.

From Investor’s Business Daily …

The chart below shows each of the 30 Dow “industrials” and its relative strength, or RS, which is a measure of how the stock has done vs. all other stocks in the last 52 weeks.

Alcoa’s 63, for example, shows that it has outperformed 63% of the market; American Express’ 45 means 55% of other stocks have done better.

Market-leading stocks generally have relative strengths of 80 or better, and only Caterpillar and DuPont fit into that category or come close. Their performance, however, says less about what’s going on in America than about conditions elsewhere: 62% of their business is done overseas.

The same can be said of the Dow components with the next-highest ratings — Coca-Cola and McDonald’s.

The average relative strength of the other 26 is 38, deep in laggard territory.

Fact is, it’s been years and sometimes decades since these once-great and still-significant companies have shown true market leadership.

Source: IBD,What Really Drives The U.S. Economy?, 11/26/2010
http://www.investors.com/NewsAndAnalysis/Article/555017/201011261902/What-Really-Drives-The-US-Economy.htm

When you adjust stock gains for inflation … uh-oh !

December 29, 2009

TakeAway: Adjusted for inflation, the Dow would have to rise 28% just to get back to 1999 levels.

* * * * *

Excerpted from WSJ: Adjusted for Inflation, Dow’s Gains Are Puny, Dec. 28, 2009

Stock analysts sometimes like to note that the Dow today is worth 27 times its value at its 1929 pre-crash peak, meaning that even if you bought at the worst moment, your stock still would be way up over time. In inflation-adjusted terms, however, the Dow today is only a little over twice its 1929 peak.

Many investors realize that stocks have been among the worst investments of the past decade. But they may not realize quite how bad the decade was, because most people forget about the effects of inflation.

Despite its 2009 rebound, the Dow Jones Industrial Average today stands at just 10520.10, no higher than in 1999. And that is without counting consumer-price inflation.

In 1999 dollars, the Dow is only at about 8200 and would have to rise another 28% or so to return to 1999 levels. Using today’s dollars and starting at 10520.10, the Dow would have to surpass 13460 to get back to its 1999 level in real, inflation-adjusted terms.

image

All of this might be enough to put investors off stocks entirely, until they consider the long-term alternatives.

Measured over the 1978-2008 period, rather than over just one decade, stock performance in real-real terms actually is better than that of just about any other major investment class: 4.5% a year. Stocks’ ability to keep up with inflation over the very long haul may be their best selling point.

In real-real terms, stocks did better over that period than municipal bonds (2.5% a year), long-term government bonds (2% a year) and corporate bonds (0.2% a year).

Real-real home prices were unchanged over those 30 years.

Both short-term government bonds and commodities suffered losses.

Full article:
http://online.wsj.com/article/SB10001424052748703991304574621903850508632.html?mod=WSJ_hps_MIDDLEThirdNews

10 years ago … when the Dow first broke thru the 10,000 barrier … versus now.

October 15, 2009

Remember when the Dow hit 10,000 in 1999?

CNBC put together an interesting “then & now” re: what was happening then and what’s happening now.

Worth browsing … will make you smile (and moan).

http://www.cnbc.com/id/33309699/

* * * * *

Follow-up: An irony of SEC fines … double jeopardy for shareholders ?

September 8, 2009

In an Aug. 26 post, we raised the question of whether it was double jeopardy for shareholders if the SEC to fines a company for misleading or defrauding its shareholders.
https://kenhoma.wordpress.com/2009/08/26/an-irony-of-sec-fines-double-jeopardy-for-shareholders/

Apparently, the courts are asking the same question …  coincidence?

* * * * *

WSJ, The BofA Bonus Show, Sept.4, 2009 

A judge is doing a public service by exposing what looks like a drive-by political shooting.

The SEC brought a civil lawsuit, alleging that BofA had misled investors by failing to disclose certian Merrill Lynch bonuses in the proxy documents it sent to shareholders in November, prior to the takeover vote. A beleaguered BofA in early August settled with the SEC for $33 million, neither admitting nor denying wrongdoing.

In pursuing BofA, the SEC’s broke with its policy of pursuing individuals, rather than companies, in cases of alleged fraud against investors. The SEC had adopted that policy under former SEC Chairman Christopher Cox for the sensible reason that fining a company essentially penalizes shareholders twice. “The same shareholders who were deceived in the first place” pay again out of the “corporate treasury.”  To add injury to insult, in this case the shareholders are also U.S. taxpayers, who have bailed out BofA to the tune of $45 billion.

The SEC’s defense is that it would be too difficult to go after BofA management, since individuals will claim their decisions were advised by corporate lawyers and are protected by attorney-client privilege. In other words, the SEC enforcement staff realizes it is easier to wrench a settlement out of a politically vulnerable company than it is to build a case against the responsible individuals.

The judge declared the SEC’s decision to go after BofA shareholders rather than individuals “at war with common sense” and has refused to endorse it.

How this kind of enforcement deters fraud or helps investors is a mystery.

Full article:
http://online.wsj.com/article/SB10001424052970204731804574387044194076168.html?mod=djemEditorialPage

^ ^ ^ ^ ^

Mr. Dow and President Obama … hmmmm

September 1, 2009

Earlier in the month, I posted that:

I think the recent stock market run-up is largely attributable to Pres. Obama’s declining approval ratings … and the numbers seem to corroborate the conclusion.

https://kenhoma.wordpress.com/2009/08/05/whats-driving-the-stock-market-higher-heres-an-analysis-you-wont-see-on-cnbc/

A team of of crack Gallup analysts has concluded that Presidential Approval shows no clear relationship to the Dow Jones Industrial Index.

Glancing at Gallup’s own chart, I ask: “Say what ?”

image

http://www.gallup.com/poll/122567/Presidential-Approval-Dow-No-Clear-Relationship.aspx

* * * * *

An irony of SEC fines … double jeopardy for shareholders ?

August 26, 2009

The story

Gotcha: “B of A to pay $33M fine over Merrill bonuses”

On August 3,  the Securities and Exchange Commission filed charges  against Bank of America for misleading investors about billions of dollars in bonuses paid to top executives at Merrill Lynch following its purchase of the brokerage giant.

The SEC simultaneously announced that it would settle with the Charlotte, N.C.-based lender, who will pay a penalty of $33 million as a result.

Regulators alleged that Bank of America failed to disclose plans to as much as $5.8 billion in bonuses for fiscal year 2008 in its proxy statement. Instead, Bank of America told shareholders that Merrill had agreed not to pay year-end performance bonuses, according to the SEC.

“Failing to disclose that a struggling company will pay out billions of dollars in performance bonuses obviously violates that duty and warrants the significant financial penalty imposed by today’s settlement,” Robert Khuzami, Director of the SEC’s division of enforcement, said in a statement.

http://money.cnn.com/2009/08/03/news/companies/bank_of_america_sec/index.htm?postversion=2009080315

The Question 

Who really pays fines imposed by the SEC?

Think about it …

B of A misleads shareholders by failing to disclose material information.

Shareholders lose money as B of A stock drops.

SEC fines B of A for misleading shareholders.

B of A pays a fine to the SEC.

Where did the fine’s funds come from?

You guessed it, shareholder’s equity.

So, in the final analysis, shareholders pay a fine for having been mislead.

… and I thought double jeopardy was illegal.

Hmmm.

Note: This one is even more interesting since taxpayers own a chunk of B of A.

So, taxpayers are paying a fine to themselves.

Our government at work …


* * * * *

What’s driving the stock market higher? …. Here’s an analysis you won’t see on CNBC (continued)

August 6, 2009

A loyal reader replied to my original post “ You’re too focused on Obama’s disapproval ratings”, the market is reacting in a “normal” way to a Democratic president. He referenced a Forbes article by investment guru Ken Fisher.

The Obama Effect. Ken Fisher, 06.03.09
http://www.forbes.com/forbes/2009/0622/wall-street-stocks-obama-portfolio-strategy.html

“Wall Street marks down stocks before a Democrat takes office–before, in fact, he is even elected. After the inauguration there’s a good chance for a rebound.

With Democratic politicians the big fear is about how antibusiness and anticapitalist they will be.

Obama says lots of stupid, scary things. That fear hit markets early in the election cycle (and early after inauguration).

But once  in office the overwhelming motivation of a left-of-center President slowly morphs toward getting reelected.

Achieving that means pandering more to the independent voters and liberal Republicans, less to the Democratic power base.

Obama’s concern now is the recession and the job creators that can take us out of it. That means slowly backing off soak-the-rich, anticorporate talk over time.

The reverse happens with Republicans. They come in riding high expectations for pro-business, pro-growth policies–and inevitably disappoint investors as they drift away from their power base. Optimism fades, depressing stocks.”

* * * * *
Ken’s Take: Rather than contradicting my original point (market buoyed as O’s disapproval increases), I think Fisher’s observation supports it. 

Though O is in battle mode now to push through Cap & Tax and nationalized healthcare, the market is assuming that the increasing opposition (as indicated in the disapproval numbers) will make him come to his senses and move to the middle, i.e. start to act more like a “normal” Democratic president. 

My prediction stands: if O fends off the opposition now, stays way left, and gets C&T and ObamaCare … the market will tank.  We’ll see.

* * * * *

Thanks to Mike for the feedback.

* * * * *

What’s driving the stock market higher? …. Here’s an analysis you won’t see on CNBC.

August 5, 2009

I think the recent stock market run-up is largely attributable to Pres. Obama’s declining approval ratings … and the numbers seem to corroborate the conclusion (chart below plots O’s disapproval rating vs the DJIA).

Specifically, when O’s approval dropped below 55% (i.e. disapproval increased above 45%) in late June, the market started a big rally.  Of course, correlation doesn’t necessarily connote causation.  So, what’s the explanation?

Simple.  The market is scared to death of Cap & Tax, Trillion $ Government Healthcare, and astronomical national debt.  As O’s approval flags, odds go against T&C and ObamaCare.  The market is factoring in severely watered down initiatives … or a long, long delay in the legislative process.

Pay close attention to O’s approval ratings and public support for ObamaCare.  If those two related metrics gain renewed traction, the market will stall – and probably will tank again.  Just watch.

image

* * * * *

Call it a push after 100 Days … the stock market, that is.

May 4, 2009

OK, so where do we stand in the market after 100 days of change & hope.

The bad news: right where we started .

The good news: right where we started.

Obama inherited a Dow that was hovering around 8,500 … higher around election time … lower after th election … then hanging in a narrow range.

After a sell-off to under 7,000  – the market has fought it’s way back into the range between 8,000 and 8,500.

So, I’ve got to stop saying that Obam killed the market (he did, but I don’t have the proof yet) … and other folks have to quit talking about an Obama rally. 

Fair enough ?

image

* * * * *

Want more from the Homa Files?
Click link =>
  The Homa Files Blog

The “wealth effect” … err, make that the “drop in wealth effect”

March 19, 2009

Excerpted from IBD, ” Wealth Connection”, March 13, 2009

Economy: The Federal Reserve last week announced that Americans’ net worth took an $11.2 trillion hit in 2008 — the biggest on record.

Net worth — basically, the value of everything you own minus the debt you took on to buy it — plunged 9% from 2007’s $64.4 trillion to $51.5 trillion last year. In the fourth quarter alone, Americans lost $5.1 trillion in wealth. Both are records.

This is more than just a paper reduction in wealth. Such a big shift affects our behavior, making us less prone to take risks, less able to borrow, less able to spend and more anxious about the economy.

This is known as the “wealth effect.” When wealth rises, we spend more; when it falls, we spend less. For each $1 change in wealth, spending changes by 5 cents or so, economists say.

Across the economy, such impacts can be enormous. An $11.2 trillion drop in national wealth, for instance, translates into a $560 billion drop in spending — about $1,963 for every American.

This is why economists worry about net worth. If we don’t do something about stemming the decline in wealth and encouraging wealth accumulation, our economy will continue to struggle.

* * * * *

image


Full article:
http://www.ibdeditorials.com/IBDArticles.aspx?id=321837955855701

* * * * *

Want more from the Homa Files?
Click link =>
  The Homa Files Blog

“The stock market is just another political tracking poll” … huh?

March 10, 2009

Ken’s Take:

A few weeks ago, a reader replied to one of my posts joking (I think) that Pres. Obama must be shorting the market the way he’s talking and acting.  Suddenly, the reply isn’t sofunny.  There may be method to the madness.  If the stock market impact is most felt by (previously) wealthy folks, hen the decline levels the playing field — a stated Obama goal —  making everybody worse off and more dependent on the government.  Think about it.

Even if you pin all of the stock market drop on Bush, it’s clear that Obama isn’t taking any direct initiative to stem the decline.  The non-stimulus plan is conforming to the Congressional Budget Office’s assessment that it will have little or no impact in 2009.  And, actions that might steady the market — e.g. lower capital gains taxes on stocks bought in 2009 and 2010, restoration of the uptick and short selling rules — are dismissed out of hand as favoring the rich.

* * * * *

Excerpted from NY Post, ” Obama’s search for an enemy”, March 8, 2009 

The President dismisses the growing perception he is adding to the economic pain. Asked about the markets, Obama waved them off as like a “tracking poll in politics” that “bobs up and down day to day.”

It was a telling moment, for the markets on his watch have moved almost exclusively down. And the 55 million households that hold mutual funds are watching their savings and retirements vanish in great gobs.

Most are decidedly middle class, making them collateral damage of this war.

* * * * *

Full column:
http://www.nydailynews.com/opinions/columnists/goodwin/index.html

* * * * *

Want more from the Homa Files?
Click link =>
  The Homa Files Blog

Stock funds drew inflow In January … then gave it up in February

March 9, 2009

Ken’s Take: Mutual fund inflows are generally an indicator or market strength.   Chmn Bernanke testified that Jan. inflows were up.  Made me curious re: the actual data.  He forgot to mention that February outflows more than offset January’s inflows. Oops.

* * * * *

Source: IBD, “Stock Funds Drew Inflow In January”, 2/26/2009

In a notable reversal, investors stuffed $9.05 billion into stock funds in January.

It was the first inflow into stock funds since May 2008, after seven straight months of outflow.  January’s net inflow was a sharp U-turn from December’s $20.43 billion outflow.

It was a welcome contrast to January 2008’s net outflow of $43.67 billion. January is one of the biggest inflow months of any year. That’s often when bonuses get invested and retirement accounts get started or funded.

Still, there were indications that the situation deteriorated during February.

The inflow couldn’t make up for the declining stock market in January. Fund assets fell by $191 billion, or 2%, to $9.411 trillion in January from $9.601 trillion the month before. They stood at $11.999 trillion at the end of December 2007.

Stock fund assets fell $269.1 billion, or 7.3%, to $3.439 trillion from $3.708 trillion the prior month. They were $6.521 trillion at the close of 2007.

Early indications were that flows decreased in February. Stock funds gave back $10.6 billion in February through Feb. 24

http://www.investors.com/editorial/IBDArticles.asp?artsec=19&issue=20090226

image

* * * * *

Want more from the Homa Files?
Click link =>
  The Homa Files Blog

What’s killing the Dow ?

March 6, 2009

Excerpted from WSJ, “Obama’s Radicalism Is Killing the Dow”, Boskin, March 5, 2009

It’s hard not to see the continued sell-off on Wall Street … (and) the realization that our new president’s policies are designed to radically re-engineer the market-based U.S. economy, not just mitigate the recession and financial crisis.

The illusion that Barack Obama will lead from the economic center has quickly come to an end. Instead of combining the best policies of past Democratic presidents — John Kennedy on taxes, Bill Clinton on welfare reform and a balanced budget, for instance — President Obama is returning to Jimmy Carter’s higher taxes and Mr. Clinton’s draconian defense drawdown.

From the poorly designed stimulus bill and vague new financial rescue plan, to the enormous expansion of government spending, taxes and debt somehow permanently strengthening economic growth, the assumptions underlying the president’s economic program seem bereft of rigorous analysis and a careful reading of history.

Unfortunately, our history suggests new government programs, however noble the intent, more often wind up delivering less, more slowly, at far higher cost than projected, with potentially damaging unintended consequences. The most recent case, of course, was the government’s meddling in the housing market to bring home ownership to low-income families, which became a prime cause of the current economic and financial disaster.

On the growth effects of a large expansion of government … the European social welfare states have standards of living permanently 30% lower than ours.

A financial crisis is the worst time to change the foundations of American capitalism.

Full article (worth reading):
http://online.wsj.com/article/SB123629969453946717.html?mod=article-outset-box 

* * * * *

Want more from the Homa Files?
Click link =>
  The Homa Files Blog

Is Obama intentionally driving the market down ?

March 3, 2009

Excerpted from CNBC, “Stop Trading!: Obama: Enemy of Stocks?”,  March 2,2009

Mad Money host Jim Cramer is worried that the same shareholder-unfriendly approach the White House took toward Medicare … could hurt the Pentagon (defense related) as well.

“We’ve got to get over the idea that you can make money on the long side with Obama,” Cramer said.  “That has proven to be very difficult.”

Cramer recommended instead that investors preserve cash and assume a protective stance against any future White House moves.

Full article:
http://www.cnbc.com/id/29468637

* * * * *

Want more from the Homa Files?
Click link =>
  The Homa Files Blog

Why the market continues to sink …

February 25, 2009

Excerpted from IBD, “Is It Any Wonder The Market Continues To Sink?”,  February 20, 2009

* * * * *

Last Oct. 13, in trying to explain why the market had sold off 30% in six weeks, we acknowledged that the freeze-up of the financial system was a big concern. But we cited three other factors as well:

• The imminent election of “the most anti-capitalist politician ever nominated by a major party.”

• The possibility of “a filibuster-proof Congress led by politicians who are almost as liberal.”

• A “media establishment dedicated to the implementation of a liberal agenda, and the smothering of dissent wherever it arises.”

No wonder, we said then, that panic had set in.

* * * * *

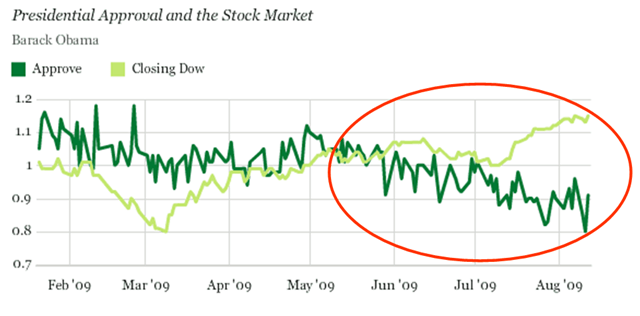
Today, as the market continues to sell off , we wish we had a different explanation. But it still looks, as we said four months ago, “like the U.S., which built the mightiest, most prosperous economy the world has ever known, is about to turn its back on the free-enterprise system that made it all possible.”

How else would you explain all that’s happened in a few short weeks? How else would you expect the stock market, where millions cast daily votes and which is still the best indicator of what the future holds, to act when:

• Newsweek blares from its cover “We Are All Socialists Now

• A $700 billion bank bailout, $75 billion to refinance bad mortgages, $50 billion for the automakers, and as much as $2 trillion in loans from the Fed and the Treasury fail to build confidence in our free-enterprise system.

Talk of “nationalizing” U.S.’ troubled major banks comes not just from tarnished Democratic Sen. Chris Dodd,  from Republicans like Sen. Lindsey Graham , and former Fed chief Alan Greenspan.

• A stimulus bill laden with huge amounts of spending on pork and special interests is the best our Congress can come up with to get the economy back on track. Economists broadly agree that the legislation has little stimulative power, and in fact will be a drag on economic growth for years to come. Throwing hundreds of billions of dollars at profligate state governments and programs — such as $4.2 billion for “neighborhood stabilization activities” and $740 million to help viewers switch from analog to digital TV— has investors shaking their heads.

• A $75 billion bailout for 9 million Americans who face foreclosure, regardless of how they got into financial trouble, is the government’s answer to the housing crunch. Many Americans who have scrupulously kept up with payments are steaming at the thought of subsidizing those who’ve been profligate or irresponsible. And. recent data shows that as much as 55% of those who get foreclosure aid end up defaulting anyway

Energy solutions ranging from the expansion of offshore drilling and the development of Alaska’s bountiful arctic oil reserves to developing shale oil in America’s Big Sky country, tar-sands crude in Canada and coal that provides half the nation’s electric power, are taken off the table.

•• Trade protectionism passes as policy, even amid the administration’s lip service to free trade. Congress’ vast stimulus bill and its “Buy American” provisions limit spending to U.S.-made products and will drive up costs, limit choices and alienate key allies. Already, several European partners have begun raising barriers.

• A 1,000-plus page stimulus bill is bulled through Congress with not a single member of Congress reading it before passage.

Business leaders are demonized. Yes, there are bad eggs out there like the Madoffs and Stanfords. But most CEOs are hugely talented, driven, highly intelligent people who make our corporations the most productive in the world and add trillions of dollars of value to our economy.

• Words like “catastrophe,” “crisis” and “depression” are coming from the mouth of the newly elected president, rather than words of hope and optimism. Instead of talking up America’s capabilities and prospects, he talks them down — the exact opposite of our most successful recent president, Ronald Reagan, who came in vowing to restore that “shining city on a hill.”

* * * * *

All this in barely a month’s time. And to think that more of the same is on the way seems to be sinking in. Investors are watching closely and not caring for what they see. Sooner or later, the market will rally — but not without good reason to do so.

Full article:
http://www.ibdeditorials.com/IBDArticles.aspx?id=320027936229029

* * * * *

Want more from the Homa Files?
Click link =>
  The Homa Files Blog

Markets bounce … Is that a light at the end of the tunnel ?

January 7, 2009

Though light trading volumes may be exaggerating movements and most pundits say a bear market that remains under way, there are some bright signs in the markets …  at least a short-term bounce, if not a turnaround.

* * * * *

Excerpted from WSJ, “Suddenly, a Markets Turnaround”, Jan.  7, 2009

From junk bonds to currencies, mortgages, stocks and commodities, the markets that were most battered in the second half of 2008 are staging rebounds, sometimes of 10% and more from their low points.

The breather comes as the U.S. government continues to push investors toward taking more risk because the returns on risk-free assets like Treasury bonds are extremely low.

The Dow has gained 19.37% from its November low point, and the S&P 500 is up 24.22%.

Still, the fear has ebbed somewhat in the shell-shocked credit markets. Junk bonds have rebounded by over 11% from their low in December … and higher-quality corporate bonds have gained more than 4% amid an increasingly robust calendar of new offerings. Led by GE, at least $6.6 billion in new corporate bonds were offered Tuesday yielding investors well over 6%, compared with Treasury bonds, which yield between 0.1% and 3%.

The Fed has cut interest rates nearly to zero, and by June, the Fed plans to buy $500 billion, or nearly one-tenth of the entire $5 trillion market for good-quality bonds backed by mortgages that conform to standards set by Fannie Mae and Freddie Mac.  The hope is that by midyear the plan will have brought down mortgage rates and sparked enough refinancing that the housing market may bottom, which would give banks more leeway to lend money into the economy. Consumers have already been applying in droves to refinance their mortgages as the average 30-year fixed rate conforming mortgage hovers just over 5%.

The Fed’s buying, which would average out to about $4 billion a day, has already sent spreads in the mortgage market almost back to what traders call “normal.” Before the credit crisis took hold, the yield of an average agency-backed mortgage bond was 1.5 to 1.6 percentage points over comparable Treasury bonds.

After hitting 2.8 percentage points in late November, that spread finished Tuesday at 1.7 percentage points.

Still, many investors and market participants  are concerned about what happens when the Fed help  dries up.

“The government can make mortgages cost 3%, but they can’t improve anyone’s credit score”

Though major indexes’ gains from their November lows so far fit the traditional definition of a bull market, up 20%, few participants are interpreting them that way. Many say the market’s recent.

image

Full article:
http://online.wsj.com/article/SB123128801585159197.html?mod=testMod 

* * * * *

Want more from the Homa Files?
Click link =>
  The Homa Files Blog

Bold Stroke: Cut capital gains rate on stock … to ZERO … here’s how & why

November 17, 2008

McCain was onto something when he proposed cutting the capital gains rate to 7.5% for the next year or two.  But, he left the idea half-baked and, as usual, didn’t communicate it very well

Here’s my bold stroke:

How:
Cut the capital gains rate to ZERO on stocks (not derivatives or other funky financial products) that are purchased after, say, November 15, 2008 and held for 12 months or until January 1, 2010 — whichever is longer.

Why:
The market seems to be a buying opportunity now, but investors are reluctant to jump in.  Why? Because of fear that (1) the market hasn’t bottomed — lending is stalled, TARP is a mess, earnings are deteriorating (2) Obama hasn’t backed off on his plan to increase capital gains rates.

The 2nd fear is the easiest to fix.  Eliminating the capital gains taxes on “new” stock purchases would tilt the risk-reward equation a bit.  Maybe enough to draw some capital off the sidelines and into the market — boosting stock prices, or at least providing some low-end support.

* * * * *

Want more from the Homa Files?
Click link =>
  The Homa Files Blog

The "Barack Effect" on the stock market … and a remedy

November 14, 2008

Reminder: I made my election predictions on November 3, 2008. OK, McCain didn’t eek out a win. But, I also predicted:

“If Obama wins, and the Dems fail to reach a 60 in the Senate, the Dow will close Wednesday below 9,000 — will hit 7,500 before the end of the year — will fight back to around 10,000 — and will hover around 10,000 for a long, long time.”

I didn’t foresee the election day rally, so the steep day-after drop didn’t quite push the market below 9,000.  But, in the week since, it has gone down 14%.

Note: My prediction stands that if the Dems win Georgia, Alaska, and Minnesota to get to 60 Senate seats, the market will drop 1,000 points faster than you can click your fingers.

Keep reading …

* * * * *

Excerpted from WSJ, “A Barack Market”, November 13, 2008 

The voters may be full of hope about the looming Obama Presidency, but so far investors aren’t. No President-elect in the postwar era has been greeted with a more audible hiss from Wall Street. The Dow has lost 1,342 points, or about 14%, since the election

Much of this is due to hedge fund deleveraging, as well as dreadful corporate earnings reports and pessimism that the recession will be deeper than many had hoped. But there’s little doubt that uncertainty, and some fear, over Barack Obama’s economic agenda is also contributing to the downdraft.

The substance of what Mr. Obama has promised for the economy is bearish for stocks. The threat of higher tax rates, especially on capital gains and dividends, now may be getting priced into the market. Add that to investor doubts about Democratic policies on unions, health care and trade — and no wonder stocks are falling. Lower stock prices in turn reduce household net worth, thus slamming consumer confidence and contributing to what appears to be a consumer spending strike.

If Mr. Obama wants to reassure markets, he could announce that he won’t be raising taxes for the foreseeable future. This no-tax-hike declaration is a “stimulus” that would cost the U.S. Treasury nothing.

In the current market, there won’t be many capital gains and few companies will have surplus earnings to pay out in dividends. A higher tax rate on zero gains yields zero revenue, so what’s the point of raising rates?

What markets want to see from Mr. Obama is a sense that the seriousness of this downturn is causing him to rethink the worst of his antigrowth policies.

Full editorial:
http://online.wsj.com/article/SB122653625916922633.html

* * * * *

Ken’s Take:

The editorial  advises the President-elect to reassure markets by announcing that he won’t be raising taxes for the foreseeable future.

I suggest a bolder stroke with more upside potential: reduce the capital gains rate to ZERO  for stocks bought between, say,  November 15, 2008 and December 31, 2010 that are held at least 12 months or until January 1, 2010 — whichever is longer.

This move would radically tilt the risk-return balance by eliminating the looming capital gains rate risk, and by increasing the after-tax rates of return for investors who step-up now when we need them. It would do more than reassure the markets.  It would pull cash in from the sidelines. Perhaps, a lot of cash.

And maybe, if the impact is grand enough, the program would be extended beyond 2010.  Imagine that.

* * * * *

Want more from the Homa Files?
Click link =>
  The Homa Files Blog

Mr. Toad’s Wild Ride … a.k.a. the stock market

October 21, 2008

Excerpted from Business Week, Oct. 27, 2008

* * * * *

By all measures, market volatility has heightened recently. Tthe spread between daily S&P 500 highs and lows is averaging over 50 points, vs. about 25 points in the first eight months of 2008.  The VIX — an index of S&P volatility — has almost tripled in the past couple of weeks. 

* * * * *

Ken’s Take:  Jacked from financial advisor Dave Ramsey (who probably jacked it from somebody else) –“Hold on tight — you usually don’t get hurt on a roller coaster unless you jump off”

image

 image

Source:
http://images.businessweek.com/ss/08/10/1016_numbers/2.htm

* * * * *

Want more from the Homa Files?
Click link =>
  The Homa Files Blog


%d bloggers like this: