A few years ago I stumbled on a Dogbert cartoon. At the time it made me smile.

Today, the cartoon makes me nervous — very nervous.
Of course, the source of my angst is the Obama tax plan. But, my specific concerns aren’t the ones that most pundits dwell on.
* * * * *
Buying Votes
True, Obama did hijack Dogbert’s campaign strategy and plans to raise tax rates on the top 3% of income earners (individuals and couples earning over $250,000 annually) and to redistribute the “savings” via a new tax credit of $500 per person, or $1,000 per working family.
Cynics point out that in the good old days, Mayor Daley’s Chicago political machine could deliver a vote for a the price of a pack of cigarettes. Apparently the price of a vote has gone up more than the price of gasoline. At least votes are now “marked to market”. The Obama plan clearly sets the price at $500 (cash) per vote, with a perpetuity value of about $10,000 @ 5%.
* * * * *
Buying Old Folk’s Votes
And, Obama promises zero Federal taxes for seniors over 65 on income up to $50,000 .
Mark Penn, Hillary Clinton’s former chief strategist says: “The Obama camp hit a bull’s-eye with this proposal, which has little economic justification but is great politics.” http://www.politico.com/news/stories/0708/12117.html
* * * * *
Upping High Bracket Marginal Rates
In a WSJ op-ed, Stanford economics professor Michael Boskin opines that despite the rhetoric to the contrary, Obama’s increases don’t just hit “rich” individuals. They also impact lot of small businesses and two-earner households in high cost-of-living areas.
Specifically, Obama would raise the top marginal rates from 35% to 39.6%, increase the tax rate on capital gains and dividends, and uncap Social Security taxes (which currently are levied on the first $102,000 of earnings).
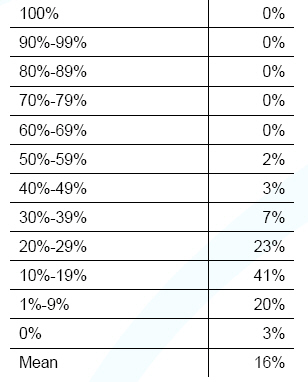
When payroll and state income taxes are thrown in, Boskin estimates that the high bracket marginal rate goes to over 60% — with almost $2 of every $3 earned at the margin, going to the government for services and redistribution.

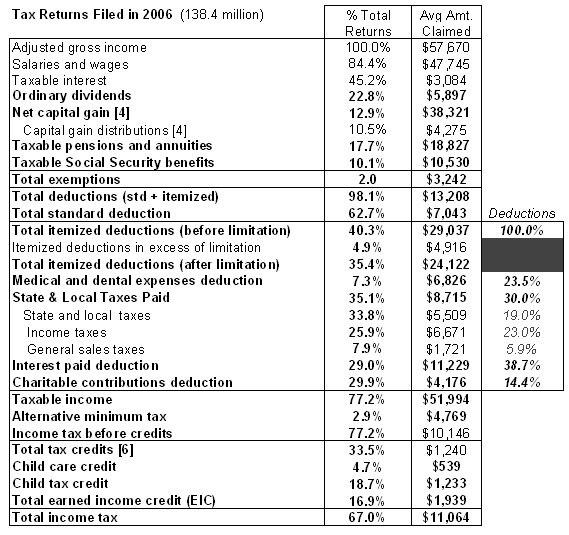
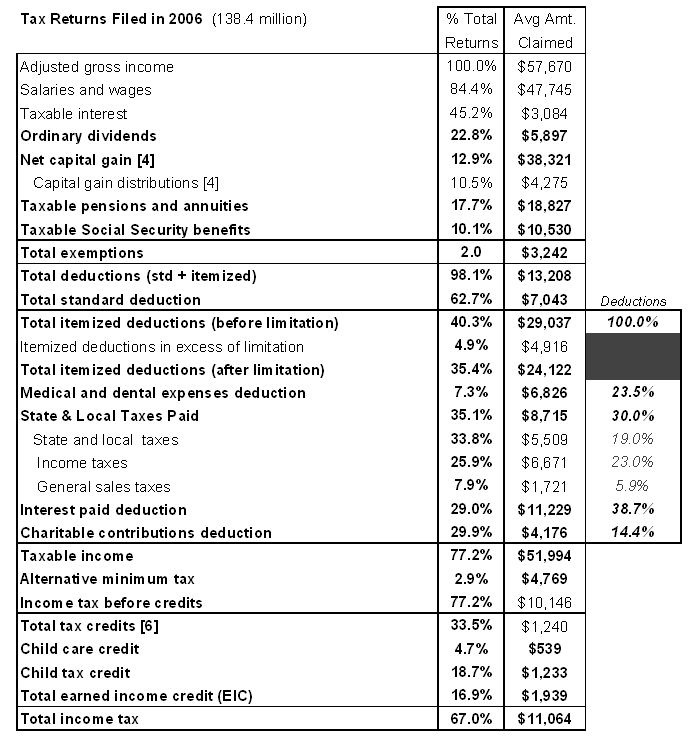
click to make table bigger
http://online.wsj.com/article/SB121728762442091427.html?mod=opinion_main_commentaries
* * * * *
Redistributing $131 Billion Annually
An analysis done by the Tax Foundation — a self-proclaimed non-partisan think tank — indicates that Obama’s plan — as proposed — would redistribute about $131 billion each year. Taking money from the undeserving rich, and giving it directly to the financially besieged middle (and lower) class).

- Source: Tax Foundation – Tax Policy Center Estimate

“Hard Numbers on Obama’s Tax Redistribution Plan
http://www.taxfoundation.org/publications/show/23319.html
* * * * *
My POV
1. On a philosophical level, I agree that the grossly uneven distribution of earning power in the US is a serious problem that needs to be fixed.
2. But, I don’t think that the problem of income inequality should be fixed via a tax system — which was originally intended to “tax & spend” efficiently on necessary common services — not to “grab and redistribute”. Direct transfers from one citizen’s pockets to another’s (e.g. refundable tax credits) are certainly the latter.
3. Except for the impact on small businesses, I can’t get too riled over marginal rate increases that start at $350,000; but I do think a “doughnut hole” payroll tax schedule is wacky and I think raising capital gains taxes during an economic slowdown is dangerous.
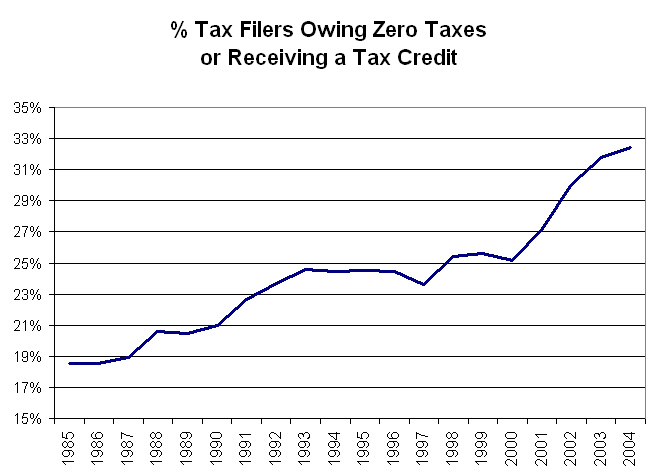
4 . My real issue: The numbers say that in Obama World, a minority of voting age Americans will be paying income taxes. That scares me. What’s to stop an income tax-free majority from continually voting to raise taxes on the tax-paying minority to fund an ever increasing potpourri of benefits or add to the redistribution pot.
* * * * *
Next Up: The numbers are conclusive … taxpayers will be a minority.
* * * * *
Want more from the Homa Files?
Click link => The Homa Files Blog


