Archive for the ‘Uncategorized’ Category

Starbucks – Grasping for (iced coffee) straws ?

August 6, 2008

Excerpted from CNN.com Aug. 5, 2008

Looking to bring more value-seeking consumers through its doors for a late afternoon caffeine fix, Starbucks … now offers its morning customers any iced grande beverage for $2 after 2 p.m.

The price is a big cut from the normal price of most grande-sized iced drinks. A grande iced latte, for example, costs about $4. To get the discount, customers must present a receipt from their morning Starbucks visit.

The company said it is …  answering consumers’ calls for more value at the chain, which has seen traffic drop as gas prices rise and consumer spending falters.

“It’s easy for baristas to implement and it’s easy for customers to understand.”

In some cities, it has offered discounted drinks on Fridays, Saturdays and Sundays. In July, the chain also gave away 12-ounce iced coffees on Wednesdays to customers in New York City, Philadelphia, Washington, Boston and Detroit who turned over an “iced brewed coffee card,” a reusable voucher distributed in stores and newspaper inserts.

“Certainly a discounting approach could lead to a better perception of value in the short run but the longer-term question remains — at the regular everyday price point, would the consumer still see Starbucks as offering the right value for them?”  “That remains uncertain.”

Full post:
http://www.cnn.com/2008/US/08/05/starbucks.deal.ap/index.html

* * * * *

Observations

1.  “Easy for customers to understand” … they’ve got to be kidding … the more hoops that folks have to jump through, the less likely a promotion will succeed.

2.  How will they handle loyal customers who don’t do coupons (or morning coffee) and see the guys in front of them get a half-priced iced-coffee.

3. Does Starbucks know that 2-bucks (no “bounce back” coupon) gets you an large iced coffee at Mickey D’s?  Mrs. H. seems to like them …

4.  Ken’s fundamental law of marketing: if you you want to do something, do it … don’t do it half-way with hooks, lines, and sinkers … otherwise, just don’t do it.

* * * * *

Thanks to Dave Fedlam MSB MBA ’09 for the heads-up … Dave says ” as a typical non-Starbucks customer, 2 cups of coffee for $6/day doesn’t really seem like much of a deal at all.”* * * * *

Want more from the Homa Files?
 
Click link =>  The Homa Files Blog

* * * * *

Uh Oh – McCain busted for plaigarism

August 6, 2008

John McCain’s campaign mocked Barack Obama’s celebrity status with a TV commercial that included comparisons to Paris Hilton.  McCain was blasted by many folks for being juvenille (true !) and by Bob Herbert of the NY Times for being racist (huh?). 

But, McCain got off clean on a very serious charge: plaigarism. 

Seems that McCain’s camp hijacked the Hilton reference from … who else, Obama himself

In 2005 Obama said: “Andy Warhol said we all get our 15 minutes of fame,” says Barack Obama. “I’ve already had an hour and a half. I mean, I’m so overexposed, I’m making Paris Hilton look like a recluse.” 

Busted, Senator McCain

See the Washington Post article “The Senator’s Humble Beginning Rising Star Barack Obama Is Resolutely Down to Earth”,  February 24, 2005
http://www.washingtonpost.com/wp-dyn/articles/A48523-2005Feb23.html

* * * * *

Other tidbits from the Post article:

“I just got elected to the U.S. Senate. I haven’t done anything yet.”

“But he comes well steeped in the basic physics of hype.”

“One of the keys to being well liked in Washington is to appear humble … All of this comes naturally to Obama.”

Even in jest, itis a rare instance where Obama lets slip with something that could be construed as immodest:

“I am genuinely somebody who doesn’t get caught up in the hype,” he says.

“You want to make everyone aware that you’re a workhorse.” As opposed to a “show horse.”

Obama is following what is known in Hill parlance as “the Hillary model,” named for the former first lady whose transition into the Senate is considered a prototype of how celebrity senators should proceed.

He invokes a favorite line: “Those who travel the high road of humility don’t face heavy traffic.”

For the full article:
http://www.washingtonpost.com/wp-dyn/articles/A48523-2005Feb23.html

* * * * *

Observation: you just can’t make this stuff up.

* * * * *

Want more from the Homa Files?
 
Click link =>  The Homa Files Blog

* * * * *

Taxes – Warren Buffett & His Secretary

August 5, 2008


HEADLINE: “Warren Buffett’s Secretary Pays More Taxes than He Does” 


The story has been making the rounds for the past couple of months and seems to be the determining data point for Barack Obama’s tax plan (e.g. “Bush’s tax cuts for the wealthy who didn’t even wamt them”).


Surprisingly (to me), everybody seems to just nod and to take the story at face value without interrogation.  Not me.


According to Buffett, he pays taxes at a lower tax rate than does his $60,000-a-year secretary, 17.7 percent and 30 percent, respectively. 


Let’s start with the secretary: $60,000 @ at a 30% tax rate. We’ll take her $60,000 salary at face value (but wonder why a generous guy like Buffett would only pay her that piddling amount).


What about the 30% rate? To be conservative and simple, let’s assume that the secretary has no dependents and takes the standard deduction.  That would give her taxable income of $50,250 ($60,000 less 1 exemption @ $3,400 and a standard deduction of $5,360) and a federal income tax liability of $8,986.25 —  $4,386.25 + 25% of the excess over $31,850.  So, the secretary’s effective Federal income tax rate is only 15% ($8,986.25 / $60,000). Hmmmm.


Well, maybe Buffet is throwing in payroll taxes for Social Security and Medicare.  OK, add on 7.65% — 6.2%  for Social Security and .1.45% for Medicare.  That gets the secretary up to 22.65%.


Still short, so add on $2,750 for Nebraska state income taxes and the secretary is up to 27%.  OK, throw in everything including the kitchen sink, give the number a hard round, and we’re up to 30%.  Not the way most people think about tax rates, but let’s not quibble.


Let’s see, $60,000 times 30% — the secretary pays $18,000 to the Federal and Nebraska coffers. 


Buffett says he earned $46 million in 2006.  Even at a measly 17.7%, that’s over $8 million. Hmmm. I’d say that the usual headline “Warren Buffett Pays Less Taxes than His Secretary” is, perhaps. just a bit deceiving. What do you think? 


More interesting (to me) is Buffett’s 17.7% tax rate. How does he get it that low.  After all, the the 35% marginal tax bracket starts around $100,000, so you’d expect that most of his $46 billion would fall into that category, right?


Well, he’s probably got clever accountants and claims some pretty staggering (but legal) deductions.  How many would he need to claim to get down to 17.7%? Easy math: his deductions would have to be about $23 million to get his taxable income down to (coincidentally)  $23 million and give him a tax bill of $8 million at a 35% rate. That’s a lot of business dinners and cab rides — especially for self-proclaimed cheapskate.


Well, maybe Buffett doesn’t pay the 35% rate.  Hmmmm. Isn’t there an Alternative Minimum Tax (AMT)?


How could he do it? That is, pay a rate way below his bracket’s 35%? 


My bet: He is a huge beneficiary of the cut in dividend and capital gains rates.  It’s my recollection that Buffett takes a modest cash comp package from Berkshire Hathaway — around .$100,000.  Since BH doesn’t pay material dividends, most of his income probably comes via capital gains — distributions and stock sales.  Tax those at a 15% rate and maybe — just maybe — he really does pay 17.7%..  But, it’s not courtesy of Bush cutting the top marginal rate to 35%.  It’s because the capital gains rate was cut to 15%.

* * * * *

Observations


1. $8 million in taxes paid strikes me as a statistically significant number — and certainly greater than $18,000.


2,  Resetting the high bracket marginal tax rate to 39% doesn’t fix the “Buffet Problem”


3.  What’s up with the AMT if it doesn’t “catch” a uber-earner like Buffett?


4.  As many others have suggested, if Mr. Buffett feels so guilty why doesn’t he just write a voluntary check to the US Treasury, and keep the Feds out of our pockets.

* * * * * 

Want more from the Homa Files?
 
Click link =>  The Homa Files Blog

* * * * *

An HBS Mole Reports …

August 5, 2008


Excerpted from WSJ review of : Ahead of the Curve, Philip Delves Broughton (Penguin Press, 283 pages, $25.95)


Broughton had one of the most desirable jobs in newspapering …  quit and went back to school to study accounting  … at Harvard Business School.


He emerged with an ambivalence toward the HBS brand  … particularly the sense of entitlement for which its students and faculty are famous.  


Most graduate business schools, you might have noticed, award MBAs. HBS, according to the dean, specializes in “transformational experiences.” The dean says that  HBS grads reject so many routine job offers that of course recruiters are going to resent the school.


Broughton was prepared for the number-crunching nerdiness, the intense competitiveness and the unrealistically high levels of self-esteem.  “HBS,” he writes, “had two modes: deadly serious and frat boy, with little in between.”


The future titans of American industry celebrated … with  everyone … dressing as his favorite hip-hop star. … at another party, the men were to dress as women and the women as sluts. . . .


It is the other mode, the serious, non-frat-boy one, that the reader may find more disconcerting.


The jargon-choked faddishness and fatuous therapeutics of pop business books and the modern workplace have seeped into HBS too …  including New Age group bonding games and …a “personal development exercise” called “My Reflected Best Self.”


Even  Broughton …  shows signs of succumbing to a version of Stockholm Syndrome — a hostage identifying, if not with his captors. “I was happy I went.” He knows how to do a regression analysis, and he has learned how to make an Excel spreadsheet do everything but play canasta.


* * * * *

A study by a banking analyst tried to track the American equity markets in relation to the number of HBS graduates who chose to go to work in finance each year. If the figure was less than 10%, the market went up not long after. More than 30% and the market was headed for a crash. In 2006, 42% of the HBS grads went to work in finance. Right on schedule.

* * * * *

Want more from the Homa Files?
 
Click link =>  The Homa Files Blog

* * * * *

Mktg: Mickey D – How to Raise Prices (w/o Raising Prices)

August 4, 2008

Excerpted from WSJ: McDonald’s Tests Changes In $1 Burger As Costs Rise, 08-04-08

McDonald’s is testing modifications to its popular $1 double cheeseburger, and higher prices for the sandwich … selling it with one slice of cheese instead of two, and billing it as a “double hamburger with cheese ” …. or offering a double hamburger without (any) cheese …  or  selling the traditional double cheeseburger at prices ranging from $1.09 to $1.19.

Launched in 2003, the Dollar Menu has been a key driver of sales at McDonald’s 14,000 U.S. restaurants and has helped it ride out dips in consumer spending. But recently, franchisees have complained that the menu has brought too much unprofitable traffic into their restaurants.

* * * * *

As of late June, sales of the chain’s lattes, cappuccinos and other espresso drinks were off their peak … lower-priced beverages, including $1.89 iced coffee and a $1 … sweet-tea promotion, have pulled some sales away from the espresso drinks … 

McDonald’s overall beverage expansion, adding espresso drinks, smoothies, cold tea, bottled drinks and ice-blended coffee beverages at U.S. locations, is on track to exceed the company’s goal of adding $125,000 a year in sales per restaurant … and adding $1 billion a year to the company’s sales.

http://online.wsj.com/article/SB121780568775808337.html?mod=2_1567_topbox

* * * * *

Observations

1.  One way to increase price is to skinny back the product — put fewer cornflakes in the box.

2.  The $1 double cheeseburger is the heart of the menu — dropping it will be a big deal — no way I step up to $1.19 or buy a chesseburger with no cheese.

3.  Has the multi-dollar cup of coffee market peaked ?

* * * * *

Want more from the Homa Files?
 
Click link =>  The Homa Files Blog

* * * * *

Exxon — Another Windfall ?

August 4, 2008

Excerpted from IBD, August 1, 2008

Exxon Mobil reported record second-quarter income — indeed, the highest quarterly profit for any corporation ever … and, a massive (tax) windfall for the US Treasury.

In the first half, Exxon Mobil’s after-tax income rose 15% to $22.6 billion. A lot of money, to be sure, until you consider that Exxon Mobil paid (almost 3 times as much) — $61.7 billion — in taxes — also a record.

As economist Mark Perry has noted, Exxon Mobil will pay more taxes this year to the U.S. Treasury than the bottom 50% of all taxpayers — combined.

* * * * *

Note: Jimmy Carter’s windfall profits tax led to a 6% drop in domestic oil output and as much as a 15% surge in oil imports, according to the Congressional Research Service.

* * * * *

For full article:
http://www.ibdeditorials.com/IBDArticles.aspx?id=302483718997031

* * * * *

Want more from the Homa Files?
 
Click link =>  The Homa Files Blog

* * * * *

Obama leads McCain among low-wage workers

August 4, 2008

Excerpted from Reuters,  08-04-08

Obama holds a two-to-one lead over McCain among low-wage workers (nearly a quarter of U.S. adults, earning $27,000 or less) … Obama’s advantage is due largely to overwhelming support from African Americans and Hispanics.

The group views Obama as the more empathetic candidate and the one who most closely shares their values …  92% of African Americans chose Obama as the candidate most concerned with their problems; not a single black respondent said that about McCain, the Post said.

Most of the respondents were pessimistic about the impact of the November 4 election. A majority of those polled, both white and minority, said that no matter who won their personal financial situation would be unlikely to change, it said.

* * * * *

Want more from the Homa Files?
 
Click link =>  The Homa Files Blog

* * * * * 


That Giant Sucking Sound – 2008

August 3, 2008

In 1992, according to then presidential candidate Ross Perot, “the giant sucking sound” was the flow of U.S. jobs to Mexico under NAFTA.  Arguably, the 2008 sucking sound is the flow of capital and corporate ownership out of the U.S.  The latest: InBev’s purchase of Anheuser-Busch

Excerpted from the WSJ, “This Bud’s for Belgium”, August 3, 2008

Politicians and Wall Streeters are starting to ask why the Belgian beer company InBev purchased Anheuser-Busch and not the other way around … though shareholders were the big winners here with a $50 billion-plus takeaway.

But here’s the real question: Was the takeover basically financed by the savings … from escaping America’s increasingly uncompetitive corporate tax system? …  Bottom line: InBev (pays Belgium) around 20% of its profits in corporate taxes … (versus) Anheuser-Busch’s U.S. rate 38.4%.

The country will continue to see its competitive edge wither away without a corporate tax rate cut. Mr. McCain … wants to cut the corporate tax rate to 25%, close to the global average. Senator Obama is more interested in raising tax rates than cutting them.

Wall Street dealmakers tell us to expect more sales of U.S. companies to European rivals thanks to the combination of America’s higher corporate taxes and the weak dollar … the U.S. is pricing itself out of the market as a corporate headquarters. “America’s 35% corporate tax rate is … just bad economics”.

For full editorial:
http://online.wsj.com/article/SB121770579562707543.html?mod=opinion_main_review_and_outlooks

* * * * *

Observations

1.  Compounding the weak dollar and high corporate tax rates is the massive transfer of wealth to the oil producing nations and their sovereign wealth funds.

2.  Rhetorical question: what’s the likely impact of a windfall profits tax on U.S. based oil companies?

* * * * *

Want more from the Homa Files?
 
Click link =>  The Homa Files Blog

* * * * *

Obama says he'll support offshore drilling

August 2, 2008

Excerpted from McClatchy Newspapers, August 1, 2008 

Headline: “In major change, Obama says he’ll support offshore drilling”

Barack Obama Friday dropped his opposition to offshore oil drilling, saying he could go along with the idea if it was part of a broader energy package. Obama made his comments in St. Petersburg during an interview with the Palm Beach Post.

“My interest is in making sure we’ve got the kind of comprehensive energy policy that can bring down gas prices …  in order to get that passed, we have to compromise in terms of a careful, well thought-out drilling strategy that was carefully circumscribed to avoid significant environmental damage.

The change is dramatic because Obama often pointed to his opposition to drilling as a key difference between himself and presumptive Republican presidential nominee John McCain.

But the concept has proven popular, and McCain has made it a centerpiece of his stump speeches and some of his television ads. Political momentum has been moving in favor of opening up U.S. coastlines.

Obama also said, in a separate statement issued by his campaign, that he supported the bipartisan energy plan offered by 10 senators Friday.

The proposal would end most of the ban on drilling. It would allow a 50-mile buffer on the east coast, as well as Florida’s west coast. Virginia, North Carolina, Georgia and South Carolina would be permitted to start oil and natural gas exploration outside the buffer. 

Currently, the government bans exploration and drilling on the Pacific and Atlantic coasts and most of the eastern Gulf of Mexico, to protect U.S. beaches and fisheries from pollution.

For full article: http://www.mcclatchydc.com/homepage/story/46174.html

* * * * *

Other confirming articles:
http://www.iht.com/articles/ap/2008/08/02/america/NA-POL-US-Elections.php
http://news.yahoo.com/s/ap/20080802/ap_on_el_pr/obama

* * * * *

Want more from the Homa Files?
 
Click link =>  The Homa Files Blog

* * * * *

Happenings – The Berlin Rock Star

August 1, 2008

Let’s play “Who am I ?”

I was born on a tropical island.

I spent some of my childhood in the United States.

Then I moved abroad with my single mother.

I have exotic good looks and magnetic charisma.

My “stage presence” is engaging beyond compare.

Fans (especially women) often faint at my events

I’ve been compared to other young “greats” who preceded me

An event in Berlin, Germany cast me onto the world’s stage.

The media adored me.

Who am I ?

scroll down for answer

       V

       V

       V

       V

       V

       V

       V

Answer

Of course, I’m Fabrice Morvan — formerly of Milli Vanilli. 

I was born in Guadalupe, moved to Miami, then moved to Paris with my single mother. 

I was modeling and breakdancing in Berlin when producer Frank Varian picked me and Rob Pilatus to become the duo fronting Milli Vanilli.  

We sold over 30 million singles, 14 million albums and became one of the most popular acts in the world. 

We played to packed venues and achieved worldwide adulation — including a Grammy.  

We were often compared to Bob Dylan, Elvis Presley, Paul McCartney, and Mick Jagger. 

Then, during a live MTV performance at the Lake Compounce theme park in Bristol, Connecticut, a playback  machine jammed. 

Only then did people realize that we were simply lip syncing recorded tracks.  While we put on a great show, we couldn’t sing. 

Fans were disappointed, we had to give back our Grammy, and our success turned to infamy as con artists. 

 “Our career came to a sudden and ignominious end: Fakers. Frauds. A blatant marketing scam. ”

* * * * *

The nuns used to teach me that history repeats.  Hmmm … 

* * * * *

Primary source: http://music.yahoo.com/ar-257262-bio–Milli-Vanilli

Additional background provided by Wikipedia – The Free Encyclopedia: – and official reference for settling Homa family bets  http://en.wikipedia.org/wiki/Milli_Vanilli

* * * * *

Want more from the Homa Files?
 
Click link =>  The Homa Files Blog

* * * * *

Hmmm – Inconvenient Facts

July 31, 2008

Excerpted from WSJ “Where’s the Outrage? Really.” Arthur Brooks,  July 31, 2008

According to an emerging journalistic narrative … ordinary Americans are outraged. The anger is simply assumed to exist. Ironically, this assumption is questionable, and is not supported by the data.

In May 2008, the Gallup Organization asked 1,200 American adults how many days in the past week they had felt “outraged.” The average number of angry days was 1.17, and 54% of those surveyed said none. … Despite the litany of horrors presented to us daily by campaigning politicians, most of us appear to be doing really quite well managing our anger.

Indeed, we are less angry today than a decade ago… (in) the glory days of the 1990s, when — according to the media narrative — we enjoyed uninterrupted peace and prosperity. In 1996, the General Social Survey asked exactly the same “outrage” question of 1,500 adults. Then, only 38% had not been outraged at all in the past week. The average number of angry days was 1.5 per week, 29% higher than at present.

Virtually every group in the population is less angry in 2008 than in 1996 … only one major group in the population has gotten angrier: people who call themselves “very liberal.”  …  Today, very liberal people spend more than twice as much time feeling angry as do political moderates. One in seven is outraged seven days a week .

Most Americans recognize that, while gas is expensive and our grocery money doesn’t go as far as it did last year, we are still an enormously prosperous and fortunate nation.

Most …  are reasonable people, and can see the difference between correctable problems within a strong system of democratic capitalism and the kind of catastrophic failure that justifies real outrage.

* * * * *

Mr. Brooks is a professor at Syracuse University’s Maxwell School of Public Affairs.

* * * * *

For the full article (worth reading):
http://online.wsj.com/article/SB121746010408198765.html?mod=opinion_main_commentaries

* * * * *

Want more from the Homa Files?
 
Click link =>  The Homa Files Blog

* * * * *

Dogbert for President – His Tax Plan

July 30, 2008

A few years ago I stumbled on a Dogbert cartoon.  At the time it made me smile. 

Today, the cartoon makes me nervous — very nervous.

Of course, the source of my angst is the Obama tax plan.  But, my specific concerns aren’t the ones that most pundits dwell on.

* * * * *

Buying Votes

True, Obama did hijack Dogbert’s campaign strategy and plans to raise tax rates on the top 3% of income earners (individuals and  couples earning over $250,000 annually) and to redistribute the “savings” via a new tax credit of $500 per person, or $1,000 per working family.  

Cynics point out that in the good old days, Mayor Daley’s Chicago political machine could deliver a  vote for a the price of a pack of cigarettes.  Apparently the price of a vote has gone up more than the price of gasoline.  At least votes are now  “marked to market”.  The Obama plan clearly sets the price at $500 (cash) per vote, with a perpetuity value of about $10,000 @ 5%.

* * * * *

Buying Old Folk’s Votes

And, Obama promises zero Federal taxes for seniors over 65 on income up to $50,000 . 

Mark Penn, Hillary Clinton’s former chief strategist says: “The Obama camp hit a bull’s-eye with this proposal, which has little economic justification but is great politics.” http://www.politico.com/news/stories/0708/12117.html

* * * * *

Upping High Bracket Marginal Rates

In a WSJ op-ed, Stanford economics professor Michael Boskin opines that despite the rhetoric to the contrary,  Obama’s increases don’t just hit “rich” individuals.  They also impact lot of small businesses and two-earner households in high cost-of-living areas.

Specifically, Obama would raise the top marginal rates from 35% to 39.6%,  increase the tax rate on capital gains and dividends, and uncap Social Security taxes (which currently are levied on the first $102,000 of earnings).

When payroll and state income taxes are thrown in, Boskin estimates that the high bracket marginal rate goes to over 60% —  with almost $2 of every $3 earned at the margin, going to the government for services and redistribution.

click to make table bigger

click to make table bigger

http://online.wsj.com/article/SB121728762442091427.html?mod=opinion_main_commentaries

* * * * *

Redistributing $131 Billion Annually

An analysis done by the Tax Foundation — a self-proclaimed non-partisan think tank —  indicates that Obama’s plan — as proposed — would redistribute about $131 billion each year.  Taking money from the undeserving rich, and giving it directly to the financially besieged middle (and lower) class). 

Tax Foundation - Tax Policy Center Estimate
Source: Tax Foundation – Tax Policy Center Estimate

“Hard Numbers on Obama’s Tax Redistribution Plan
http://www.taxfoundation.org/publications/show/23319.html

* * * * *

My POV

1.  On a philosophical level, I agree that the grossly uneven distribution of earning power in the US is a serious problem that needs to be fixed. 

2. But, I don’t think that the problem of income inequality should be fixed via a tax system — which was originally intended to “tax & spend” efficiently on necessary common services — not to “grab and redistribute”.  Direct transfers from one citizen’s pockets to another’s (e.g. refundable tax credits) are certainly the latter.

3. Except for the impact on small businesses, I can’t get too riled over marginal rate increases that start at $350,000; but I do think a “doughnut hole” payroll tax schedule is wacky and I think raising capital gains taxes during an economic slowdown is dangerous.

4 . My real  issue:  The numbers say that in Obama World, a minority of voting age Americans will be paying income taxes.  That scares me. What’s to stop an income tax-free majority from continually voting  to  raise taxes on the tax-paying minority to fund an ever increasing potpourri of benefits or add to the redistribution pot.

* * * * *

Next Up: The numbers are conclusive … taxpayers will be a minority.

* * * * *

Want more from the Homa Files?
 
Click link =>  The Homa Files Blog

Tax Payers: A Dwindling Majority

July 29, 2008

A couple of years ago, one of my sons observed that people paying income taxes would soon be in the minority.  In denial, I dismissed the notion at the time. 

More recently, I read in Dick Morris’ book Fleeced:  “When Obama is done, the proportion of adult Americans who pay taxes at all will become a minority of our population” (p.41)

Finally, curiosity (and selfish interests) got the best of me and I decided to get some facts and crunch some numbers. 

My conclusion: UH-OH !!! 

Here are some things to mull over.

* * * * *

10% Bracket

The Bush tax plan introduced a 10% tax bracket that currently applies to individual tax filers with taxable incomes less than $7,825 Over $7,825 is taxed at the ‘old’ 15% marginal rate.  For marrieds filing jointly, the 10% bracket goes up to $15,659.

Technical note: Taxable income equals Adjusted Gross Income (AGI) less $3,400 per personal exemption (the filer plus dependents), less deductions.  The standard deduction is $5,350 for individuals and $10,700 for married couples filing jointly.

* * * * *

Child Tax Credit (CTC)

Additionally, the Bush tax plan doubled the size of Child Tax Credit (CTC) from $500 per qualifying dependent child — the level introduced in 1997 —  to $1,000; and made the credit “refundable(i.e. a filer gets a check for any negative tax balance); and relaxed some of the limtations.

* * * * *

10% & CTC – So what?

Well, for example, a married couple — with 2 qualifying dependent children — filing a joint return  — can report almost $43,000 in Adjusted Gross Income (AGI) and owe no taxes 

Here’s how: The couple’s AGI of $42,850 gets reduced to a taxable income of $18,550 — $42,850 AGI less $13,600 in exemptions (4 times $3,400 per exemption), less the standard deduction of $10,700, equals $18,550.  The tax on $18,550 is $2,000 — $1,565 plus 15% of the excess over $15,650 equals $2,000.  But, the couple gets a $2,000 Child Tax Credit — $1,000 for each qualifying dependent child.  So, the couple owes no taxes.

A married couple  with 2 children who  file jointly and report less than $42,850 get a refundable credit — a check from the government — in effect, a negative income tax.

* * * * *

Earned Income Tax Credit (EITC)

Similarly, the revised tax code provides for an Earned Income Tax Credit (EITC) based on a relatively complicated formula:

click table to make it bigger

So what?

Well, for example, an individual with no child dependents can report up to $10,416 in AGI and owe no taxes.  Those who report less than $10,416 in AGI, get a refundable credit. (Just trust me on the calculations — even if they’re not precise, I ‘m confident that they’re directionally right)

The table below displays the maximum AGI that individuals can report — and that maried couples can jointly report, depending on their number children — without owing income taxes i.e. their “zero-tax AGI)


click table to make it bigger

* * * * *

Bottom 40% – Negative Income Taxes

Based on Congressional Budget Office (CBO) & Tax Foundation analyses of IRS data, the bottom 40% of tax filers — as a group — have negative tax liabilities. 

That is, on average,  the effective tax rates of the bottom 40% of filers are negative. So, the filers in these quintiles get a refundable credit paid by the government.

Technical note: These are averages ! Some filers in the group may pay some income taxes — but their tax liabilities are more than offset by filers with negative tax balances.  And, as will be shown in a subsequent post, some filers in the middle quintile — which has a positive average effective rate — have negative tax liabilities.

click table to make it bigger

Sources:
http://www.cbo.gov/ftpdocs/88xx/doc8885/12-11-HistoricalTaxRates.pdf
http://www.urban.org/UploadedPDF/1001091_distribution_federal_taxes.pdf

* * * * *

32% of filed returns – Zero (or Negative) Income Tax Liability

Of those in the bottom 40%, roughly 80% (i.e. over 32% of total filers) paid zero taxes or received a refundable credit.

* * * * *

41% of U.S. Population – Zero (or Negative) Income Tax Liability

Economists at the Tax Foundation estimate that — for the 2006 tax year — roughly 43.4 million tax returns, representing over 32% of the 136 million returns filed) and 91 million individuals, faced a zero or negative tax liability.

In addition to the 91 million, about 15 million low and no income households (averaging 2 people per household) are not required to file tax returns.  

So, roughly 121 million Americans—or 41 percent of the U.S. population—  pay no income tax, or — benefiting from the earned income tax credit or child credits — get a “refundable credit” back from the goverment (i.e. a check for “negative income tax”).

Source: Tax Foundation: “Number of Americans Outside the Income Tax System”
http://www.taxfoundation.org/research/show/542.html

* * * * *

59% Think Everyone Should Pay Something 

Source: HarrisInteractive, 
http://www.taxfoundation.org/files/topline-20050414.pdf

* * * * *

Next up: Will tax payers become a minority (of voting adults) any time soon?  If so, so what?

* * * * *

 Want more from the Homa Files?
 
Click link =>  The Homa Files Blog

Hmmm: Obama Visits Doctor (on a Sunday Night !)

July 28, 2008

The Story

CHICAGO — Barack Obama, back in his home town after a tour of Afghanistan, the Middle East and Europe, saw a doctor at the University of Chicago Medical Center on Sunday night to deal with a sore hip, inflamed from playing basketball.

My POV  (POV = point-of-view)

1) Obama promises that when he’s elected, we’ll get exactly the same health care that Senators get.

Does that mean that my doctor will see me on a Sunday night (for “soreness” no less)  instead of telling me that the next open appointment slot is 6 weeks from Tuesday at 1:46 — come early, but plan to wait?

Must be, because Obama certainly wouldn’t think of accepting preferential care, right?

2) Why do all of the candidates confuse “medical insurance” with “health care” ?  The former is just money; the latter is fundamental service delivery.  Two different things !

Amen.

* * * * *

Want more from the Homa Files?
 
Click link =>  The Homa Files Blog

Hmmm – Some Interesting Tax Stats

July 28, 2008

Summary: To load you with some interesting factoids for cocktail party conversations and to provide background for the next couple of analytical posts — here are some highlights from the 2006 IRS data pile (the latest year available) , and the link to the complete IRS data set (which is a treasure trove of info).

Some Highlights

138.4 million returns filed … reporting almost $8 trillion in AGI
         
 … up 8.4% from 2005 …  $57,670 average AGI

23%  reported dividend income … averaging $5,897

10.5%  reported capital gains … averaging $4,275

 63%  took the standard deduction … averaging $7,043

 37%  itemized deductions … averaging $24,122

 30%  reported charitable deductions … totaling $173 billion

2.9%  were assessed Alternative Minimum Tax
              … averaging $4,769

 19%  claimed child tax credits … averaging $1,233

 17%  claimed earned income tax credits … averaging $1,939

 67%  paid income taxes … averaging $11,064

   33%  paid zero taxes (or received a refundable tax credit) 
                … up from 20% in 1990 and 25% in 2000 


 * A deeper dig on this point is coming in subsequent posts *

* * * * *

Summary Table:

click table to make it bigger

Source: IRS
http://www.irs.gov/pub/irs-soi/06in01fg.xls

* * * * *

Next up: Taxpayers –  A Dwindling Majority

* * * * *

Want more from the Homa Files?
 
Click link =>  The Homa Files Blog

Randy Pausch: The Last Lecture

July 25, 2008

Randy Pausch, the Carnegie Mellon University computer science professor whose final lecture inspired millions, died early today (July 25) in Virginia of pancreatic cancer.

Last fall, Dr. Pausch delivered the lecture at CMU, which has attracted more than six million viewers. (link below)

Dr. Pausch wrote a book, “The Last Lecture,” which … elaborated on his lecture and emphasized the value he placed on hard work and learning from criticism. His words were intended as a legacy for his young children.

In May, Dr. Pausch spoke at the Carnegie Mellon commencement. He said a friend recently told him he was “beating the [Grim] Reaper” because it’s now been nine months since his doctor told him he would die in six.

“But we don’t beat the Reaper by living longer. We beat the Reaper by living well,” said Dr. Pausch, who urged the graduates to find and pursue their passion. 

Watch the Last Lecture:
http://youtube.com/watch?v=nwO7EnM0zWM

Excerpted from the Pittsburgh Gazette 

* * * * *

Want more from the Homa Files?
 
Click link =>  The Homa Files Blog


Update: XM – Sirius Merger – Finally!

July 25, 2008

After more than a year of government review (largely instigated by a powerful “over the air” radio lobby led by the National Association of Broadcasters), it looks like the merger between XM Satellite Radio and Sirius Satellite Radio — is finally going to happen.

in March, the Justice Department approved the merger.  Last month (June), FCC Chairman Kevin Martin gave his ok, saying:  “I am recommending that with the voluntary commitments they’ve offered, on balance, this transaction would be in the public interest. They have voluntarily committed to setting forth price constraints, so the prices for consumers do not increase; smaller packages at lower prices; an open standard for radios; the sale of interoperable radios; and additional public interest programming for noncommercial use and for qualified entities who have not been traditionally represented.”

Two of the five FCC members commission quickly followed Martin’s lead and  announced that they would cast votes to approve the deal.

Now, their are reports that at least one of two other members of the FCC (John Adelstein, Deborah Taylor Tate), is ready give the merger the majority vote it needs provided that XM-Sirius up the ante by freezing prices for six years, by making 25% of their satellite capacity available for public-interest and minority programming, and by paying a $2o million fine for some minor technical violations of FCC transmission rules.

For more details:
http://online.wsj.com/article/SB121683130281477651.html

* * * * *

Performance Update

The companies broke even financially, and ended the 1st quarter of 2008 with a total of almost 18 million subscribers — 9.33 for XM, 8.64 for Sirius. (Reminder: The original “Bass Model” research studies projected the market would be at least 25 million).

XM’s subscriber acquisition costs (SAC), a component of cost per gross addition (CPGA), were $73.  CPGA in was $99 for XM, $91 for Sirius

XM converted  53.3 percent of OEM installations (i.e. radios already installed in new cars)to subscriptions. XM’s monthly churn rate was 1.77 percent.

* * * * *

TEST QUESTION: Given a monthly subscription price of $12.99,  what’s the customer life time value (CLTV) of an average satellite radio subscriber? Answer below

* * * * *

Observations

1. The prolonged merger approval process — which took longer than the approval of the Exxon-Mobil merger — certainly validates the political clout of the “over the air” media companies.  To a reasonably objective person (me), this one was a no-brainer.

2. Finally, I’ll be able to get the NFL and MLB on the same service.

3. I still think that converting about half of the OEM units pre-installed in new cars is cause for concern, not celebration.  Any marketer worth his / her salt wouldn’t sleep well at night until the conversion ration was at least over 75%. 

4. My Lexus RX-350 didn’t come with either XM or Sirius pre-installed.  The dealer treated the installation as a minor annoyance, and said less than half of their customers opt for satellite radio..

5. Big question: too late to matter? My sense: the buzz is gone and momentum  is gone.  Your views?

 * * * * *

Next up: Back to taxes …

Want more from the Homa Files?
 
Click link =>  The Homa Files Blog  

* * * * *

Answer to CLTV Question:
Assuming nil marginal operating costs per customer (though there would be some), and a 5% annual discount rate ( .4% monthly):
CLTV = [MS$ / (C% + DR%)] – CGAC
MS$ = monthly subscription = $12.99
C% = churn rate =  .0177
C% + DR% = .0177 + .004 = .0217
[MS$ / (C% + DR%)]  = $12.99 / .0217 = $598.61
$598.61 – CGAC = $598.61 – $95 (avg for XM & SIRI) +
$503.61

Taxes – Tax Breaks for the Wealthy?

July 24, 2008

The 2008 presidential campaign is loaded with tax rhetoric.  The GOP says that the Bush tax cuts have worked and it would be crazy to raise taxes during an economic slowdown. 

The Dems say that the Bush tax plan “gave tax breaks to the rich, who didn’t even want them” — as evidenced by Warren Buffet repeatedly saying that he pays less taxes than his secretary — and that uber-earning people — e,g, greedy CEOs and hedge fund managers — aren’t paying their fair share.

What do the numbers say?

Well, several pivotal conclusions can be drawn from a comparison of published IRS data for 2000 (the year immediately prior to the first wave of so-called “Bush Tax Cuts for the Wealthy”) to the data from 2005 (the last year of IRS data available):

1. The effective tax rate for the top 1% of tax filers — those reporting AGI greater than $365,000 — did go down 4.32 percentage points from 27.45% in 2000 to 23.13% in 2005 — a 16% reduction; the effective tax rate for the top 5% earners (which, of course, includes the top 1%) went down 3.64 percentage points from 24.42% in 2000 to 20.78% in 2005 — a 15% reduction. 

Note: “effective rate” is actual income taxes paid divided by income; “marginal rate” is the percentage of “last dollars earned” paid in taxes.  So-called “payroll taxes” for Social Security and Medicare are not included (see ana;ytical note below).


2. But — and it’s a big “but” — the effective tax rate for the bottom 50% of all tax filers (those reporting less than $28,875) also went down — from 4.62% in 2000 to 2.98% in 2005 — “only” 1.62 percentage points, but representing a whopping 36% cut from the 2000 rate.

Note: 32% of tax filers paid zero income taxes or received refundable credit checks from the government


3. And, the amount of taxes paid by the top 1% as a group was approximately the same in 2000 ($388.9 billion) and 2005 ($368.1 billion); ditto for the top 5% — $553.7 billion in 2000 and $557.8 billion in 2005. 

4. During the same time period, the tax proceeds from the bottom 50% of tax filers dropped almost 25% — from $38.3 billion in 2000 to $28.7 billion in 2005. 

5. So, the tax burden absorbed by the top 1%  increased by 2 percentage points from 37.4% of total income taxes paid in 2000 to 39.4% of total income taxes paid in 2005; the top 5% share of the tax burden increased by 3.2 percentage points from 56.5% of toal income taxes in 2000 to 59.7% in 2005; the bottom half’s share of total income taxes paid dropped from 3.9% in 2000 to 3.1% in 2005. 

6. Taking a longer run view, the share of the income tax burden shouldered by the top 1% has roughly doubled over the past 25 years — from about 20% of total income taxes paid to about 40% of all income taxes paid; the share of the income tax burden shouldered by the top 5% has has increased roughly 25 percentage points over the past 25 years — from about 35% of total income taxes paid to about 60% of all income taxes paid. 


7.  The share of income taxes borne by the bottom half of tax filers has fallen from over 7% to about 3%.


* * * * *

Observations

I. The picture is certainly different when the focus shifts off marginal tax rates to the  amount of taxes paid or the share of the total income tax burden.

2. Broad based surveys indicate that people in general think the maximum percentage of a person’s income that SHOULD go to state, federal, and local taxes (in total) is 16%, with only 12% of respondents saying that the rate should be over 30%.

From a HarrisInterActive Poll:
Q 650: What is the maximum percentage of a person’s income that SHOULD go to taxes – that is, all taxes, state, federal, and local?

  the maximum percentage of a person's income that SHOULD go to taxes - that is, all taxes,
http://www.taxfoundation.org/files/topline-20050414.pdf

3. A tax burden of 60% of taxes paid by 5% strikes me as a pretty high number — especially since it’s 5% of tax filers not 5% of citizen-voters. Of course, “fair share” is in the eye of the beholder …

* * * * *

Data deck: 02-irs-tax-quartiles-key-metrics
Primary data source: http://www.taxfoundation.org/news/show/250.html

* * * * *

Analytical Note: This post, and a few follow-ons that I have in process, focus on individual federal income taxes.  That distinction excludes corporate taxes (an entirely different animal), state taxes (a crazy quilt of different programs), and so-called “FICA” or “payroll taxes” (for Social Security and Medicare).  The latter exclusion is admittedly dicey.  Employees’ paycheck deductions for Social Security and Medicare are a constant percentage of income (6.2% + 1.45% = 7.65%), up to $102,000 in earnings.  So, many people argue that the assessments are “regressive.”  Nonetheless, I consider these charges to be more akin to forced savings or deferred income plans since contributions are matched by employers and since the benefits received (e.g. retirement income and health insurance) are directly tied to the level of contributions.  So, I choose to outboard them from “tax and spend” analyses.  

* * * * *

Next up: More on income, deductions, credits, and taxes.

* * * * *

Want more from the Homa Files?
 
Click link =>  The Homa Files Blog

Taxes – Fair Share ?

July 22, 2008

Excerpted from the WSJ Editorial: “Their Fair Share”, July 21, 2008


“No President has ever plied more money from the rich than George W. Bush did with his 2003 tax cuts … The latest IRS data … show that the 2003 Bush tax cuts caused what may be the biggest increase in tax payments by the rich in American history.

The top 1% of taxpayers, those who earn above $388,806, earned 22% of all reported income and paid 40% of all income taxes in 2006, the highest share in at least 40 years.

The top 10% in income, those earning more than $108,904, paid 71% [of all income taxes]..

Americans with an income below the median paid a record low 2.9% of all income taxes, while the top 50% paid 97.1%.”

The WSJ editors project: If tax rates are raised on the rich — the Obama plan — their share of tax payments will fall. The last time tax rates were as high as Obama wants them — the Carter years — the rich paid only 19% of all income taxes, half of the 40% share they pay today. Why? Because they either worked less, earned less, or they found ways to shelter income from taxes so it was never reported to the IRS as income.


For full editorial:
http://online.wsj.com/article/SB121659695380368965.html

* * * * *

Observations & Questions

1. This isn’t new news, but seems to get swept under the carpet — largely because of legitimate concern for the uneven distribution of earning power in the U.S.

2. What is if “fair share”? Who should decide what it is? On what basis? Ability to pay ???

3. What is the goal of the income tax system: “collect and spend”(on necessary gov’t services) or “take and redistribute”

4. Based on cocktail party conversations, the WSJ is certainly right on at least point: folks are already starting to think about tax strategies to cope with likely tax rate increases. 

5. Warning: This editorial aroused my curiosity — so, several posts on the topic are on their way … with numbers, of course.

Want more from the Homa Files?
 
Click link =>  The Homa Files Blog

Energy – Alternative Energy Initiatives

July 21, 2008

Political candidates and pundits are talking like the energy crisis is new news, and even O’Reilly rants that the Bush administration has done absolutely nothing about it.  They conveniently overlook programs aimed at the development of hydrogen fuel, advanced energy technologies, and renewable fuels.

 Click chart to make it bigger

For details, see the DOE summary presentation:
http://www.energy.upenn.edu/docs/EWGP-Milliken-slides.pdf

The cornerstone of the program is the Advanced Energy Initiative (AEI) — which was announced in Bush’s 2006 State of the Union address .  The AEI’s stated goals  are to reduce our dependence on oil (especially foreign sourced) and to reducing emissions of greenhouse gases and other pollutants).

Specifically, the AEI was tasked with accelerating the technical and cost viability of alternative energy technologies for vehicles (e.g. plug-in hybrid vehicles,   fuel cells, and biofuels, including “cellulosic” ethanol derived from agricultural waste, forest residues and dedicated energy crops such as switchgrass), and for homes and businesses (e.g. nuclear power, clean coal, solar, and wind).

An important component of the AEI is critical basic research that should help overcome major technical barriers to the expanded use of technologies such as solar energy, cellulosic ethanol, energy storage, hydrogen fuel cells, and fusion energy.

For details of the AEI:
http://www.whitehouse.gov/stateoftheunion/2006/energy/energy_booklet.pdf

The initial enacted budget for AEI was $1.77 billion in FY2006; the proposed FY 2009 Budget is  $3.17 billion:
          

http://www.ostp.gov/galleries/Budget09/AdvancedEnergyInitiative1pager.pdf

* * * * *

Observations

1. Critics argue that the too little, too late, misdirected … with too little emphasis on convervation standards and processes.  The critics may be right, but some visibility and credit should be given for getting the ball rolling.

2. The next president will take over with the ball close to the end zone on some of the initiatives.  Watch whoever it is punch it in for the touchdown, dance in the end zone, and claim credit for the entire scoring drive.

3. The Bush team may be the worst marketers in the entire free world.

4. Gotta ask: what did Al Gore do in the 8 years he was hanging around the White House? I guess it’s easier to be bold and visionary when you don’t have responsibility … 

* * * * *

Worth browsing:  the U.S. DOE Energy Efficiency and Renewable Energy (EERE) web site: http://www.eere.energy.gov/

* * * * *

Want more from the Homa Files?
 
Click link =>  The Homa Files Blog


Idea – Revive the Hybrid Car Tax Credit

July 18, 2008

As of the end of 2007 (before the recent surge in gas prices), there were just under 1 million hybrid vehicles in use in th U.S.

http://www.eere.energy.gov/afdc/data/docs/hev_sales_model_year.xls

As I recounted in a prior post, I was surprised that  — for practical purposes —  there aren’t any tax credits available for hybrid cars to offset some of their price premium over conventional autos.

The Energy Policy Act of 2005 provided income tax credits up to $3,400 (depending on the make & model of car), for hybrids purchased by individuals after January 1, 2006. 


But, the credits weren’t applicable to taxpayers falling into the Alternative Minimum Tax category, and only the first 60,000 hybrid vehicles sold by each manufacturer qualified.  The allowable credits were phased out as manufacturers approached their 60,000 limits. 


For example, a Prius qualified for $3,150 credit on January 1, 2006.  That got cut to $1,585 on October 1, 2006; $785.50 on April 1, 2007; and to zero on October 1, 2007.


     See  http://www.fueleconomy.gov/feg/tax_hybrid.shtml for current hybrid tax incentives


The price premium for hybrids is somewhere between “statistically significant” and — with long payback periods — “economically disqualifying “.


So, wouldn’t it make sense to reinstitute some kind of tax incentive to stimulate the shift? It could be done quickly — with the stroke of a couple of pens.  


Make it big enough to matter, keep it both simple (no silly sliding scales) and broadly available (folks paying AMTare penalized enough), and watchdog the auto companies and dealers so they don’t just inflate the prices.

Want more from the Homa Files?
 
Click link =>  The Homa Files Blog


Autos: A Run on Used “Econocars”

July 17, 2008


Excerpted from  “Want a Used ‘Econobox’? Better Get in Line”,
WSJ: July 16,2008


The appeal of fuel efficiency is moving beyond the new-car market and creating a run on small used cars. Used economy cars … are now flying off the lots, and prices are rising.  Sustained high gasoline prices are pushing more drivers out of their gas-guzzling SUVs and into what were once called “econoboxes.”  


But because economy models haven’t been big sellers for the past few years, car makers have built relatively few of them. The resulting tight supply and strong demand have driven up prices.


“We find that the big ticket is 30 mpg,” says Norm Olson, sales operations manager for Toyota’s certified used-car business … Buyers are interested “in just about anything with four cylinders’ because those are the cars that will travel more than 30 miles per gallon.


For car shoppers, the run on econoboxes has a downside: Consumers have to pay top dollar for small used cars, even as they get lower trade-in values for their large vehicles. Some buyers may also be deterred by the higher upkeep costs of older cars   the average amount spent on a car in the fourth year of its life, according to J.D. Power & Associates, is $398..


Full article

http://online.wsj.com/article/SB121617183225056575.html

Thanks to MSB-MBA alum Jason Bates for the heads-up

Want more from the Homa Files?
 
Click link =>  The Homa Files Blog


Econ: Hybrid Cars – Tough Sell

July 16, 2008

Summary: Hybrid vehicles offer many advantages: environmental friendliness, HOV lane access, better gas mileage.  But, based strictly on economic value to the customer (EVC), it’s tough to justify buying one – especially since dealers are discounting conventional models during the current auto sales slowdown, and selling hybrids near (or above) sticker prices   I know, I shopped, I bought.  Here’s my story, replete with numbers.

                    * * * * *

OK, after 9 years and 143,500 miles — it was time to trade in my 1999 Lexus RX300 SUV.  And, with gas prices north of $4 per gallon, it made sense to consider a hybrid. 

Buying a hybrid would certainly be the “right” thing to do – more green, less gas,  But, being an economically rational guy (think “cheap”), my decision quickly centered on the economics: would the price premium being charged for hybrids, in effect, pay for itself?

Two decisions simplified my buying process.

First, I still wanted an SUV.  Sorry, but with 2 big dogs and occasional Home Depot trips,  I do enough hauling to justify it psychologically.

Second, Lexus was my brand choice since the RX300 served me well  for almost a decade, and since Lexus has a competitive  advantage in hybrids — thanks to its accumulated experience with Prius.

Specifically, I narrowed my choice set to the Lexus RX350 (updated version of my current car) and its cousin — the Lexus RX400h – a functionally comparable hybrid version.

Before leaving the house, I pulled  price and tech data  from the usual car sites: Yahoo-Autos, Edmunds, Kelly Blue Book, and CarMax … and crunched some numbers.

First, I wanted to know how much I’d save on gas if I bought the hybrid. 

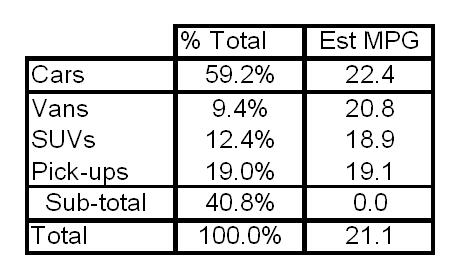
The RX350 is government rated at 17 MPG in city driving and 22 MPG on the highway; the 400h is rated at 26 MPG city and 24 highway.  I was a bit surprised that the only significant difference is on city driving – slow speeds and lots of starts & stops; highway driving is essentially a push.

I drive about 12,000 miles annually (right at the national average).  I don’t keep track of my split between city & highway mileage.  In fact, I’m not exactly sure what defines the distinction, e.g. is driving down Route 7 in northern Virginia at 45 MPH city or highway?  Without belaboring the distinction,  I simply assumed that my miles are split roughly 50 / 50 between city and highway.

Given my driving pattern and  these MPG ratings, I would expect an RX400h to burn 480 gallons of gas each year (6,000 miles at 26 MPG, and 6,000 miles at 24 MPG).  An RX350 would burn 622 gallons each year (6,000 miles at 17 MPG, and 6,000 miles at 22 MPG).  

So, the hybrid would use about 142 fewer gallons of gas annually.  At the current $4 per gallon, that’s an annual savings of about $566 

Next step: compare the gas savings to the price difference in the cars.

The base price of a RX400h is $42,980; the RX350 is $39,100.  So, assuming a comparable set of equally priced options, the “hybrid premium” between the cars is $3,880. 

I checked for available tax incentives that might be available, and was surprised to find that the tax credits  provided by the Energy Policy Act of 2005 had expired for all but a few low volume makes & models.   More on that in a subsequent post.  

So, it looked like I’d be staring at a $3,880 purchase price difference (over $4,000 counting sales taxes) that would take me almost 7 years to breakeven ($3,880 divided by $566 equals 6.85 years).

Note: To be technically “pure”,  the future gas savings I should be discounted back to a present value.  Using a 5% discount rate, the breakeven is pushed out to a little more than 8 years.

Since holding a car for 7 years is the national average, and since I’ve owned my current car for 9 years, it seemed that the hybrid would be a contender.

Reality set in when I got to the local dealer. No surprise, the lot was full of RX 350s , but there were only a couple of RX400h hybrids.  The salesman volunteered that he “had room” to discount the RX350s, but that the hybrids were going “pretty close” to list price.

Sure enough.  After a couple of hours of haggling, The dealer’s “hard” offer was $48,970 for a loaded RX400h hybrid (about 2% off the sticker price), and  $41,500 for a comparably featured RX350 (about 10% off the sticker price).

Bottom line: The real hybrid price premium turned out to be $7,500 – an 18% price spread between the RX350 and the RX400h.

So, my nominal “pay back” period was pushed out to 13 years ($7,500 divided by $566 per year in gas savings equals 13.25 years); the NPV breakeven was pushed out to over 20 years.  Said differently, gas prices would have to double to $8 per gallon (starting today), to get the payback down to average ownership life of about 7 years.

My conclusion: the RX350 had a compelling economic advantage over the RX400h — its hybrid cousin.  While I admit to some guilt , I concluded that $7,500 is a lot of money and 13 years is a long time. Guess which car I drove off the lot … 

                                 * * * * *

Some observations:

1. The experience reaffirmed my view that anybody who thinks they’re pulling anything over a car dealer is fooling themselves.  Man, do they know how to bob & weave with the numbers, and there is no end to the “adders” they try to throw in.  Aggressive negotiating seems to only minimize the “damage”.  What happens to the average guy off the street?

2. I expected even more of a fuel advantage from the hybrid – and didn’t expect the difference to be almost entirely attributable to city driving.

3. I wonder how many folks will just compare list price differentials and understate the hybrid purchase price premium.  They may make the “right” decision – in part, by drawing wrong conclusions re: the economics.

4. The Prius might make sense for anybody who puts on a lot of mileage diving alone (few passengers, no gargantuan pets, no lumber),.  With a price tag in the low $20s, a sizable “installed base” (no notoriety, familiar to mechanics), and gas mileage over 45 MPG —  it makes both economic and environmental sense.  But, even with a Prius, you’re still paying about a dime a mile for gas …

5. I expect auto companies to keep inching hybrid’s sticker prices up and for dealers to “get healthy” selling them at or above sticker prices.  I wouldn’t be ahocked to start seeing “market area adjustments” added on the sticker prices.

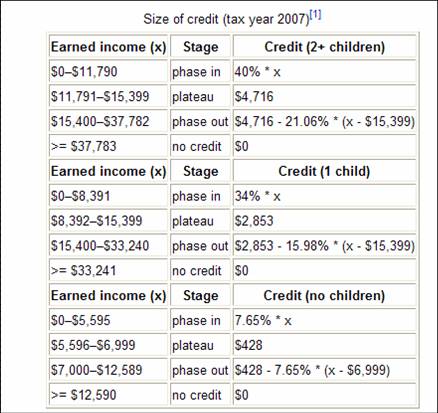
6. I was surprised that hybrid tax credits were a thing of the past.  Most of them were phased out in 2007.   More on that topic in a later post.

Want more from the Homa Files?
 
Click link =>  The Homa Files Blog

Marketing – Reviving Old Brands

July 14, 2008

New Life from Tired Brands
Excerpted from Booz & Co., Startegy+Business

Punch line: Sometimes, it’s easier and less costly to leverage the residual awareness of an archived brand than to launch a new brand from scratch.  Key is assessing the legacy brand’s actionable equity.

The story:

The Ford Taurus was the #1 US car model in the early 1990s.  Ford diluted the brand by chasing fleet volume (companies & rental cars).  Eventually, Ford decided to shelve the brand name and introduce the Ford 500 brand — a costly failure.  Ford subsequently phased out the 500,  and revived the Taurus name.  Why? Very hgh brand awareness with manageable negatives.

Booz says that you can determine if a brand has the foundation for a new life via a 4-part “tool” called BVA — Brand Vitality Assessment:

1. Purchase Funnel Assessment (PFA) — how do prospects convert from awareness to trial to repurchase?

2. Brand Equity Review — what are customer perceptions of strengths & weaknesses?

3. Competitive Dynamics Assessment — why did the brand fell off the radar?

4. Value Proposition Check — differentiating benefits worth the price?

                                        * * * * *
Observations

1. Nothing new re: analyses (we cover them all at MSB), but they’re nicely bundled and put in a useful context. 

2. May inspire some situations which have brands on the shelf that may be revivable.

3. For MSBers, should bring back memories of Markstrat.

4. Worth reading to brush up on the 4 analyses.

For full article:
http://www.strategy-business.com/resiliencereport/resilience/rr00060

Want more from the Homa Files?
 
Click link =>  The Homa Files Blog

Tunes – Chicago Live @ Wolf Trap

July 9, 2008

Most folks know that I’m a big Chicago fan — the city, the Bears, the 1st place Cubbies and — oh yeah — the rock band. 

As part of my Dad’s Day present, son Scott and daughter-in-law Jess made a wish of mine come true — finally, I got to see Chicago perform live.  WOW.  Two solid hours of hit after hit after hit. (Test: ask your friends how many Chicago songs they can name?  Bet you’ll be surprised)

Gotta hand it to a band that stays relatively intact for over 40 years, adapts to the constantly changing music scene, can still pack an outdoor venue, and acts like they really want to be there. 

There’s a lesson in there somewhere.

                                     * * * * *

Some Chicago::
You’re My Inspiration
Make Me Smile
Saturday in the Park
Feeling Stronger Everyday*
25 or 6 to 4
Only the Beginning
Hard to Say I’m Sorry
Old Days
Color My World
Wishing You Were Here

* Ken’s favorite

Oil Econ: Losing Our Financial Independence ?

July 9, 2008

Pump Prices Hurt Americans Not Just in Pocketbook

Highlights from the WSJ July 8, 2008

Referencing a McKinsey Research Study


“Both presidential candidates are focusing on the economy this week, and for good reason: $4-a-gallon gasoline has Americans sliding into pocketbook shock.


But pain at the pump is only one reason energy now should be the central issue of this year’s campaign. Here’s the other, more insidious one: High oil prices are shredding America’s financial independence and producing a massive transfer of wealth from U.S. pocketbooks into the hands of suspect actors around the world, including Iran, Venezuela and Russia.


The U.S., in other words, now has an energy problem that is not only draining the bank accounts of its own citizens, but filling up the bank accounts of some who work against American interests around the globe … Oil-producing countries are accumulating piles of excess cash that they can use — and are using — to buy pieces of Western companies … (to buy) the  U.S. Treasury bonds that finance the federal government’s budget deficit (foreigners buy 80% of all newly issued Treasury bills) … (and) to advance anti-American political [and military] agendas.


To their credit, Sens. John McCain and Barack Obama are trying to raise awareness of the corrosive national-security effects of oil prices. In his recent centerpiece address on energy, Sen. McCain declared: “When we buy foreign oil, we are enriching some of our worst enemies.” As far back as last fall, Sen. Obama said in a speech that money spent on foreign oil “corrupts budding democracies and allows dictators from hostile regimes to threaten the international community.” 
                                              * * * * *

Observations:


1.  Right now, about 1/3 of US oil is sourced domestically, about 1/3 comes from friendly nations (Canada, Mexico), and about 1/3 from problematic nations.  Let’sdrive less and drill more to at least cover the most problematic 1/3 of our consumption.


2. Both candidates have to stop parsing words and make the issue visceral —  e.g. “roughly $1 of each gallon of $4 gas goes into the pocket of folks who don’t like us and want to hurt us”  — “what are the prospects for long-term job security if US companies are increasingly foreign-owned?”


3. Shouldn’t the Congress be doing something a little more action-oriented  than “negotiating to hold a bipartisan energy summit”?  Geez guys, do something already… 
                                               * * * * *    


Full WSJ article:
http://online.wsj.com/article_print/SB121546528614733687.html


McKinsey Global Institute special research study
“The New Power Brokers, Oil, Hedge Funds, Asia” 
http://www.mckinsey.com/mgi/publications/The_New_Power_Brokers/index.asp 


Economics – Shifting Risk to Ordinary Families

July 8, 2008

Working without a net: The shift of economic risk to ordinary families .

Highlights from a Los Angeles Times article


“Economic risks — the costs of being laid off, of suffering a work-stopping illness or of a catastrophe like a house fire — that were once largely borne on the broad shoulders of business and government (are) being shifted onto the backs of ordinary families, from the working poor to the reasonably rich.


Jobs, benefits, housing, health coverage, college and retirement savings, even bought-and-paid-for insurance all played crucial roles in maintaining families’ economic stability during the second half of the 20th century. But the protective value of each has been weakened over the last generation.


On average, 60% of everything we own — is accounted for by the value of our homes …   over the last two decades … insurers phased out guaranteed replacement cost policies in favor of “extended replacement cost” policies …  It is up to you to figure out what it would cost to rebuild your home. And it is up to you to keep your policy current.


Similar(ly) …  the switch from traditional pensions to 401(k)s has left individuals largely on their own to provide for old age … the numbers have flipped. The fraction of private-sector workers relying on traditional pensions has dropped from 62% a generation ago to a mere 10% today, while the fraction depending solely on 401(k)s has jumped to 63%.


Similar changes have occurred in the way people pay for college education, where rocketing costs and the declining availability of federal grants have meant that most families can no longer pay as they go to send their kids to school, but must borrow … Twenty years ago, loans were used to pay about 15% of the tuition, room and board and fees that parents and students paid for college. Today, they account for fully one-third, according to the College Board.


Working Americans and their families are operating on an economic high wire — only one or two missteps from a steep financial fall. Little wonder people are so bleak about their prospects now that times are tough.

                                            * * * * *

Observation: Many well intended boomers have stashed money into IRAs and 401Ks.  Now, as they approach retirement, the bear market has substantially reduced the value of their nest eggs.  That, in my opinion, will be the next big financial challenge in the US.
 

                                            * * * * * 

For the full story:

http://www.latimes.com/news/opinion/la-op-gosselin6-2008jul06,0,4204915,full.story

Peter Gosselin is the author of “High Wire: The Precarious Financial Lives of American Families,”.


Brands – GM to reconsider its line-up (again)

July 7, 2008

Excerpt from the Wall Street Journal

“For decades, GM has believed a key to making money in North America was maintaining market share … and having different brands helps the company reach more potential customers and gives it more tools in fighting (competitors). 

The company currently sells vehicles under eight different brands, but most, including Buick, Saturn and Saab, struggle to attract buyers despite offering new models that cost GM billions of dollars to develop.

Critics have said keeping so many brands is a drain on resources and leaves many of its divisions competing with each other.

The company will continue to reconsider its mix of brands. All but Cadillac and Chevrolet (60% of GM sales; 12.5% market share), which GM considers core to its business, are undergoing close scrutiny,

The company has already decided to put its Hummer division up for sale.

(Another brand) under examination is Saturn, a maker of economy cars that analysts believe has never made money in its nearly 20-year history.”

                      * * * * *

Observations:

1. I always say that product is the heart of marketing strategy. Branding can only boost strong products, not perpetually cover up for weak ones.

2. In highly segmented markets (such as autos), a multiple brand strategy makes sense — as long as each brand has the potential to reach critical mass, and duplication of efforts and spending is tightly managed.

3. Remember when Saturn was GM’s star brand — a “new kind of car company” with a cult-like following?  Hmm … sound familiar? 

4. How can we expect struggling auto makers — whose highest priority is just staying alive — to lead the movement to more energy efficient cars? 

See the full article at
http://online.wsj.com/article/SB121539865693931653.html?mod=hps_us_whats_news

New – Homa Files eAlerts and RSS feeds ==>

July 4, 2008

Now, you can subscribe to eMail Alerts powered by FeedBurner. 

Just click “subscribe” and register your email address.

You’ll get an eAlert whenever there’s a new post to The Homa Files blog.

Note: You can also set up an RSS feed at FeedBurner.com

Idea: Hybridize the Govt Vehicle Fleet

July 3, 2008

Ever notice all of those Post Office mini-trucks cruising their routes?

Bet you have since the USPS is often reported to operate the largest fleet of vehicles in the country (maybe the world). 

Assume that each those vehicles is on the road 6 to 8 hours per day; probably covering 76 to 100 miles per day.  That’s 24,000 to 36,000 miles per year (2 or 3 times an average family vehicle);  At a charitable 15 MPG — that’s about 2000 gallons of gas per year. 

At a Prius-like 45 MPG, that number goes down to about 650 gallons annually — 1,350 gallons less per year.   Multiply that times the number of vehicles in the fleet (thousands),  and we’re talking MILLIONS of gallons of gas. 

Rather than coaxing consumers to buy hybrids one at a time, why not convert the entire USPS fleet in one fell swoop? 

More broadly, why not legislate that all government vehicles be hybrids, flex-fuel, or some other energy saving alternative.  Makes sense to me. 

                                     * * * * *
Side note: According to Phrases.org “fell swoop” means “suddenly; in a single action”.  They say that Shakespeare either coined the phrase, or gave it circulation, in Macbeth, 1605:

MACDUFF: [on hearing that his family and servants have all been killed]
All my pretty ones?
Did you say all? O hell-kite! All?
What, all my pretty chickens and their dam
At one fell swoop?

Limits: Starbucks Wakes Up and Smells the Coffee

July 2, 2008

STAR dims as latte hits thirty BUCKS per gallon.

Starbucks announced that it is shuttering 500 more stores (the company announced 100 closings last month), cutting 12,000 jobs (7% of its 172K “partners”), and slowing new store development.

Excerpts from the Wall Street Journal (with my take):

WSJ: “The pullback is a sign that the Seattle-based coffee giant is continuing to see weak sales as high gas prices and other pressures on consumer spending prompt Americans to cut back on extras”.

KEH: Latte @ $3 per 12 ounce serving = $31.99 … ouch

WSJ: “Starbucks has been struggling to attract customers amid the slowdown in consumer spending and increasing competition from other coffee and restaurant chains, such as fast-food giant McDonald’s.”

KEH: McD’s wins taste tests and costs $2 / cup less … Hmmm … 

WSJ: “The company said it will eliminate as many as 12,000 full-time and part-time retail positions in connection with the closures; some baristas will get jobs at other stores … Workers will find out whether their store is closing by the middle of this month.”

KEH: Isn’t SBUX supposed to be the model of kumbaya HR management?  Worse than getting fired is being told that you’ll be told in a couple weeks.

WSJ: “Starbucks said the sites earmarked for closure include those that aren’t profitable at the moment or aren’t expected to provide the company with acceptable returns on its investment.

KEH: I guess that previously, unprofitable stores with low ROIs were just fine.

WSJ: “(SBUX is coming off a period of rapid expansion intended to ) to boost sales growth and siphon traffic away from some of its stores where long lines were driving away customers … company research showed people sometimes weren’t willing to cross the street to buy a cup of coffee.”

KEH: Not to pay $5 a cup, that is.

WSJ “But the density of Starbucks stores in places like New York and other large cities turned the chain into a symbol of ubiquity, spawning countless jokes. Last year, as Starbucks’s sales began to soften, it became clear that the company’s expansion was cannibalizing its sales in a way that was threatening the chain’s success, as well as causing the quality at its existing locations to slip”.

KEH It’s called “decreasing marginal returns” … or, simply “hitting the wall”

WSJ “(CEO Howard) Schultz has been pushing through changes, including the introduction of a new, milder daily brewed coffee that the company says has helped boost Starbucks’s drip-coffee sales. But, in doing so, he has alienated a small group of loyal Starbucks customers who prefer the strong coffees on which the chain built its reputation”.

KEH: Remember New Coke? 

KEH: Starbuck’s had a great run.  Welcome to the real world.

Numbers: Driving Around

July 1, 2008

According to an ABC News Poll:

The average household owns two cars, trucks or sport utility vehicles … and one in four owns three or more … (Big idea to lower gas consumtion:: raise the driving age to 18 — 16 to 18 year olds don’t vote any way)

220 million adults average an hour and a half a day in their cars … 104 minutes for those with kids, 77 without

An average commute by car is 16 miles … and takes around 30 minutes (obviously not DC)

While about half of commuters have some form of public transportation available, only 4% use it to & from work (mostly city dwellers, minorities and lower-income Americans)

84% of driving commuters go solo … 8% regularly carpool … 20 percent of solo drivers say they’d be interested in carpooling  (yeah right — well mabe if gas stays @ $4 / gallon)

65% oppose higher gasoline taxes … even if the money is earmarked for transportation projects

66% approve of roadside cameras to enforce traffic laws (note: they didn’t survey my family)

For the complete report: http://abcnews.go.com/print?id=485098

News – Dog Overboard

June 30, 2008

Dateline:

Arnold, Maryland

June 30, 2008

9:30 a.m. EDT


A woman and two dogs were paddle boating in the Magothy River this morning.  One of the dogs – occasionally, but not dependably answering to the name “Captain” – nudged the other dog off the boat and into the crystal clear waters of the Magothy.  


The woman – identified as Kathy Homa was heard shouting, “Skipper, come”. But the overboarded dog – who is thought to be partially deaf – was dog paddling too hard to respond. 


Mrs. Homa tried to hoist the big,  black, water-logged mutt into the boat.  Her fundamentally flawed plan was predictably unsuccessful.  So, Mrs. Homa paddled like hell towards shore, hoping that Skipper would follow the boat  (rather than heading  off across the Magothy to Party Island). 


Skipper did follow the boat to shore and is back home, resting peacefully. 


Authorities  praised Mrs. Homa’s quick reactions.  No charges have been filed, but authorities said that they consider the circumstances to be “suspicious.”  They did a DPS-like canvass of the area with negative results and still consider Captain to be a “dog of interest” in their continuing  investigation.


                                                 * * * * * *

UPDATE July 2, 2008


Arnold authorites recovered a surveillance photo that clearly shows Skipper voluntarily jumping from the boat.  Captain has been cleared and is no longer considered a “dog of interest”.


Nums: Gas Consumption – Stop Blaming SUVs !

June 30, 2008

Most pundits say that we can curb gas consumption by outlawing SUVs, raising CAFE (MPG)  standards, and just plain driving less.  Here’s what the Federal Highway Administration data says:

1) An average household vehicle is driven slightly more than 12,000 miles per year … up 8% from 1992

2) There were 235 million household vehicles in the US in 2006 (latest available FHWA data) … up 28% since 1992 … about 40% of household vehicles are SUVs, vans, trucks

3) Gas consumtion (by households) was 135 billion gallons in 2006… up 27% since 1992 … almost precisely the same as the increase in the number of vehicles on the road

4) An average car’s actual MPG is 15% better than an average SUV, van, truck’s MPG … 22.4 MPG to 19.4 MPG

5) But, an average SUV is driven 5% fewer miles annually than an average car … 11,857 miles to 12,427 miles … so an average SUV only consumes 10% more gas per year … 612 gallons to 554 gallons

6) Current CAFE standards are 27.5 MPG for cars and 20.7 MPG for SUVs … an average car on the road is getting 22.4 MPG (82% of the CAFE) …  an average SUV on the road is getting 19.4 MPG (94% of the CAFE)

Bottom line: Based on the data, I don’t feel quite so guilty driving my SUV.

Keep reading for data and analysis

    * * * * *

Based on the latest full-year of data available from the Federal Highway Administration, U.S. households consumed over 135 billion gallons of gas 2006 — a 27%  increase since 1992, and a 4.5% increase since 2002. 

It’s conventional wisdom that the way to get consumption down is simply to raise CAFE standards (the MPG performance that new cars must achieve) and to get SUVs off the road.  The hard data suggests a bit more interesting story than that.  (See the complete data table below for details)

Cars vs SUVs

Again, fuel consumtion went up 27% from 1992 to 2006; during that same time period, the number of registered vehicles (passenger cars, vans, SUVs, light trucks) increased by 28% — from 184 million in 1992 to 235 million in 2006.  In other words, the percentage increase in registered vehicles almost perfectly matches the percentage increase in fuel consumption

There’s more to the numbers, though.  The mix of vehicles shifted away from passenger cars to vans, SUVs, trucks. 

In 1992, cars were almost 80% of the total; by 2006 — there were almost 100 million vans, SUVs, and trucks on the road — accounting for over 40% of the total.  No surprise there.

And, everybody knows that SUVs (for shorthand, I’ll just refer to the category of vans, SUVs, and trucka as “SUVs”) use more gas than cars, right? 

That’s true in aggreagte — SUVs as a group do use proportionately more gas than cars, but not by much   In 2006, SUVs were 42.3% of the vehicle mix and consumed 44.7% of the fuel. That’s not as much of a skew as most people think.  Why is that?

Keep in mind that fuel consumption is the product of both MPG (miles per gallon) and the number of miles driven.  SUVs do guzzle gas faster than cars — 19.4 MPG versus 22.4 MPG — a 15.8% difference in fuel efficiency. 

But, that spread gets partially offset by the miles driven.  On average, SUVs were driven 11,857 miles in 2006; cars weredriven 12,427 miles — a 5% conservation advantage to SUVs. 


Note: that average miles driven by SUVs fell from 1992 to 2002 .  A possible rationale is that many of them are substituting for and being used as cars, which historically have racked up lower average annual mileage.

So, an average SUV does use more gas per year than an average car, but the difference is only about 10%  — 612 gallons per SUV to 554 gallons per car.

Bottom line: SUVs are bad, but not as bad as many people make them out to be — they’re driven less and the actual MPG gap  has narrowed considerably (keep reading)

CAFE Standards (CAFE = Corporate Average Fuel Economy)

It’s hard to argue against CAFE standards.  There may be a limit as to how high they can be pushed, but we certainly haven’t reached that point.

The current CAFE standards (27.5 MPG for cars; 20.7 MPG for SUVs) have been in place for almost 15 years.  The actual fuel efficiency being achieved by the US “fleet” is 22.4 MPG for cars, and 19.4 MPG for SUVs.  In other words, the fleet average for cars is only 18% below the CAFE standard; SUVs achieve actual fuel efficiency almost 94% of their CAFE standard.  Why is that? 

Click  chart to make it bigger

Well, for openers, the CAFE standard for SUVs is lower.  But, more important, there’s an age mix of vehicles in operation — some cars may pre-date CAFE standards and drag down their average.  Since SUVs are relatively new to the scene, it’s seems reasonable to expect the fleet of SUVs to be newer and in closer compliance to the CAFE standards. 

So what?

1) Put more vehicles on the road and you’ll consume more gas — plain & simple.

2) Most fuel usage analyses focus on MPG — specifically CAFE standards — rather than actual MPG, or better yet, gallons per vehicle (per year).

3) Sure, less fuel is consumed if people drive higher MPG vehicles and hold mileage constant — but it doesn’t look like they do — as MPG goes up, so does mileage.

4) Pre-CAFE cars may be more of a problem than SUVs . (Note: I own an SUV and I don’t drive it that much).

Click  tables to make them bigger


Source: Federal Highway Administration,
            Annual Statistics, Report VM-1
            http://www.fhwa.dot.gov/policy/ohpi/hss/hsspubs.htm


Numbers – Price Gouging? Windfall Profits?

June 26, 2008

FYI: (a) I’m not a financial analyst or investment adviser (b) I’m not a big fan of oil companies (c) I do own some shares of Chevron Texaco  and Slumberger — not enough to sway my thinking (d) $4 per gallon for gas gives me pain at the pump, too

            * * * * *

Critics characterize oil companies’ profits as “obscene”, “unconscionable”, and “windfall”.

In a previous post, I compared Exxon Mobil (the poster boy for big oil) to two other mega-corps — Coke & Microsoft.  The data says that Exxon’s profit margins are lower, its effective tax rate is higher, and its ROA (return on assets) is well below Microsoft’s and roughly at par with Coke’s.  Draw your own conclusions.

Drilling deeper on Exxon’s financial performance over the past couple of years (see chart below for details) and putting them in the perspective of standard financial ratios leads me to 5 pivotal conclusions.

1) Exxon is a very, very big company with a market cap over $450 Billion  … so all of its numbers seem supersized

2) From “50,000 feet” , there’s no evidence of price gouging … gross margins have been flat, before and after rhe run-up in crude oil prices

3) Exxon’s already paying a lot of taxes — over 40% of pretax profits, about $90 Billion since Jan. 2005

4) There’s plenty of reinvestment … capital expenditures about 30% of cash flow

5) Almost 70% of cash flow is going directly (and immediately) to shareholders in the form of dividends and stock repurchases

Some Details

1) Size & growth: Revenues have increased by about 9% from 2005 to 2007 (2% in 2006, 7% in 2007) to a whopping $404.5 billion.  Unfortunately, it’s tough to split the increases between volume (more oil sold) and price. Seems reasonable to conclude that a lot of it is price since refinery capacity is relatively fixed.

2) Margins & prices: “Cost of Revenue” has held relatively flat at about 57.5% so, by definition, gross profit margins (the flip side of cost of revenue) have been relatively flat at 42.5%.   Translation: Exxon’s “percentage mark-up” over its costs has stayed flat — if price gouging, would expect margins (i.e. mark-up) to increase.  Of course, as costs go up, the profit margin expressed in dollars (instead of percentages) goes up.  It’s reasonable to infer that Exxon’s profit — in dollars per barrel — is increasing along with crude oil prices, but that’s not evidence of gouging behavior.

3) Taxes: Exxon paid over $90 Billion in taxes from January, 2005 to March, 2008 — an effective tax rate over 40% (46.1% in Q1 of this year)

4) Reinvestment: over the 3 year period, Exxon invested about 30% of its cash flow — almost $50 Billion — in capital expenditures (presumably for drilling rigs, refineries, etc.)

5) Shareholder distributions:in recent years, about 70% of cash flow has been distributed directly to shareholders in dividends ($31.4 Billion in 2007) and stock buybacks (about $85 Billion since Jan. 2005)

So what ?

1) Retail gas prices have gone up proportionately to crude oil prices and gross margins have been flat — where is the evidence of the much touted price gouging?

2) The financial ratios are relatively constant across the years — pre and post the crude oil run up.  Where’s the windfall?

3) An effective tax rate over 40% strikes me as pretty high.  How much higher does it need to be pushed to be a  “fair share”?

4) $50 Billion in capital expenditures — 30% of cash flow — sounds like reinvestment to me.  It’s not in alternative energy sources, but as I like to say “there’s a reason they’re called oil companies”

5) In my opinion, oil company execs have been greedy (and stupid) raking off so much compensation.  But, keep in mind that most of the company’s cash flow is going directly to shareholders, either in dividends or stock buybacks (which prop up the share price for shareholders who sell) .

Note: Exxon has about 5.3 Billion shares outstanding — about 1/2 in the hands of institutions (think mutual funds) and 1/2 held by individuals.  They invested to be owners, and they’re the direct and immediate beneficiaries of Exxon’s financial success.  Said differently, any windfall profits tax would come directly out of their pockets into somebody else’s. Think about it — how fair is that?

Click chart to make it bigger  

Numbers – Obscene Profits ?

June 25, 2008

It’s a popular refrain: oil companies are making too much money and they’re failing to develop alternative energy sources.

McCain says: “I am very angry, frankly, at the oil companies not only because of the obscene profits they’ve made but at their failure to invest in alternate energy to help us eliminate our dependence on foreign oil.”

Memo to Sen. McCain: There’s a reason they’re called “oil companies” — that’s their business — that’s what they do.

Obama says:“I’ll make oil companies like Exxon pay a tax on their windfall profits, and we’ll use the money to help families pay for their skyrocketing energy costs and other bills.”

Memo to Obama: putting more money into the hands of the buyers of relatively scarce commodities will simply bid up prices faster.  It’s  fundamental economics: called the “budget effect”. Any “relief.” is briefly transitional. 

Even O’Reilly piles on, saying that the oil companies are reaping unconscionable profits by price gouging “the folks”. 

What about the obscene,  unconscionable windfall profits?  What do the numbers say?

First, on a comparative basis, it’s tough to make the case (chart below). 

Comparing Exxon Mobil to fan favorites Coke and Microsoft is revealing: 

  • Exxon’s 17.4% EBIT (earnings before interest and taxes — a measure of their profit margins — the difference between their operating costs and the prices they charge) is lower — much lower — than either Microsoft’s (39.3%) and Coke’s (28.9%)
  • Exxon already has a higher effective tax rate (42.4%) than either Microsoft (30%) or Coke (22.7%).
  • So, Exxon’s net income after taxes (10%) is about half of Coke’s (20.7%) and about 1/3 of Micosoft’s (27.5%)

Of course, applying 10% to Exxon’s gigantic revenue base ($404 billion) gives a very big number — $40 billion.  But, it takes a correspondingly enormous level of capital investment (think rigs and refineries) to generate that level of sales.  Exxon has almost $250 billion in assets — one measure of a business’ capital intensity.  Exxon earns a 16.8% return on its assets — 5 percentage points less than Microsoft, and roughly the same as Coke (depending on whether or not Coke’s “intangible assets” are counted).

Bottom line: For sure, Exxon’s profits are high.  But, they’re not “obscene”  or “unconscionable” … unless Coke and Microsoft’s are, too.  

That leaves the question of “windfall” for a follow-up post.                               


Catch: Newt “Inspired” McCain’s Prize Idea

June 24, 2008

Yesterday, candidate  McCain called for “a $300 million prize to whoever can develop a battery that will leapfrog the abilities of current hybrid and electric cars.”

On page 199 of Real Change, Newt Gingrich says “There ought to be a billion-dollar tax-free prize for the first hydrogen car that can be mass produced for a reasonable price.”

Observations:

If you’re going to jack somebody else’s ideas, give them credit — especially if the ideas are whacky.  This one meets both criteria — jacked & whacky.

At least McCain showed fiscal restraint by making the prize only $300 million — but why $300 million? In marketing jargon, that’s not a “price point” — he could have gone down to $250 million and not lost any impact, or gone up to $500 million and referred to it as “half a billion dollars” — that has some punch.

If Obama also cops the idea, it certainly won’t be tax-free.  In fact, anything over $250,000 would probably get hit with payroll taxes …

The posted reward for capturing Bin Laden is $50 million.  By inference, it must be 6 times as tough to develop a hydrogen car — and will take at least 7 years (and still counting).    

Numbers – Oil – Financial Speculation vs. Physical Hedging

June 24, 2008

The Wall Street Journal reports that “financial speculators” currently hold more crude oil ftures than “physical hedgers” who are simply forward buying a necessary, price-escalating “factor input” to their operations.  Think: refiners and airlines.  See the prior post for data on Southwest Airline’s hedge positions.

Note : Data is from the New York Mercantile Exchange (NYMEX).  The prevailing view is that financial speculation is an even bigger piece of the action on the less regulated ICE (London based Intercontinental Commodities Exchange) and the DME (Dubai Mercantile Exchange)

Numbers – Oil Hedging – Southwest Airlines

June 24, 2008

As oil prices go up, financial speculators are garnering a lot of press and political attention, potentially obscuring the importance of commodities hedging to commercial operations (i.e. companies that actually use the oil).

When there is a scarcity projected for critical commodities — the key “factor inputs” to a company’s operations (e.g. oil for airlines) — or when prices on critical commodities are expected to increase — many companies will “forward buy” the commodities — i.e., hedge them .

One of the ways that Southest Airlines keeps costs (and prices) comparatively low has been by hedging oil.  For example, SWA bought 65% of its projected 2008 fuel requirements (roughly 1.5 billion gallons, 35 million barrels) in advance — at an average price of $49 per barrel. 


A couple of observations:

  • Only well capitalized companies can substantially hedge key commodities — that rules out most airlines.
  • Financial speculators certainly push up the price of futures contracts — though the “players” may eventually be left hanging if spot prices fall.
  • Even SWA will feel the pressure of the ‘hot’ futures markets starting in 2010 — when their proportion of relatively cheap hedged oil falls below 50%.

Heads-up to politicians: If an operating company such as SWA hedges via exchange-traded futures contracts, then raising the margin requirements on future contracts would require an enormous inflow of capital.  For example: SWA uses about 35 million barrels of oil annually.  At $135 per barrel, that’s almost $5 billion per year.  So, if SWA hedges 50% of their oil requirement over a 4 year time horizon (as they averaged for the past couple of years), then SWA would need another $10 billion in capital to support the higher margin requirements.  As a frame of reference, SWA currently has $18 billion in “total assets” (e.g.planes. airport facilities).  That would be a challenge for them, and an impossibility for more financially fragile airlines.  (Note: I’m not sure if SWA hedges via exchanged-traded futures contracts —  they may contract directly with oil suppliers — and be outboarded from exchange margin requirements)


Numbers – U.S. Oil Refinery Operations

June 22, 2008

Summary: While the number of refineries has been substantially reduced over the past 25 years (and no new refineries have been built), aggregate refining capacity has increased and refineries have operated practically “full out”.   Source EIA (Energy Information Administration)

In 2008, there are half the number of operating refinerie in the US as there were in the early 1980s … mostly due to the retirement of outdated facilities that couldn’t be economically reengineered to meet increasingly strict environmental regulations.


Refinining capacity has increased from under 16 million barrels per day (mbpd) in the mid-1990s to over 17.5 mbpd in 2008 — an increase of more than 10%.


US oil refineries are consistently operated at utilization levels above 80% of “operable capacity” … which is generally considered to be the practical  “full out”, given normal downtime for repairs and maintenance. 

http://tonto.eia.doe.gov/dnav/pet/hist/8_na_8o0_nus_ca.htm

Survey: Pick Your Favorite

June 21, 2008


Copyright protection established on June 21, 2008

Book Summary – Real Change by Newt Gingrich

June 21, 2008

 
Real Change: From a World that Fails to a World that Works
      by Newt Gingrich (former Speaker of the House)
  

Theme: activist citizenry must rise up to make government work … it won’t happen on its own due to entrenched (unionized) bureaucracies and power-hungry partisan political parties. 

Factoids & Interesting Points: 

  • It’s insane to the same thing and expect a different result (credit to Albert Einstein) 
  • Easier to be in the minority – just complain and object. 
    Majority must lead — come up with big ideas and implement them
     
  • Politicians are much better at campaigning than governing
  • Republican strategy: narrow partisan target. negative messaging, voter turnout … only works for a few campaign cycles … shrill messages eventually lose their edge and effectiveness … people can’t stay angry long enough 
  •  Democratic strategy: pander to small, specific activist segments, e.g. unions, environmentalists, who can only “win” with gov’t control and ultimately resist change to the status quo … leverage the money & visibility of the elites ( media, show biz, uber-rich) …problem: promises never materialize, mostly due to cost and ineffective government bureaucracies (waste & fraud)
  • More African-American males in prison than in college … for some, prison brings street cred … many inner-city entrepreneurs – they just operate outside the law 
  • In NYC, vice cops worked 9 am to 5 pm … drug dealers worked 9 pm to 5 am … since dealers wouldn’t change their work schedules, Rudy made the cops change their schedules
  • High school “on time” graduation rate less than 50% in Cleveland, LA, Miami, Dallas, Denver … 40% in NYC  … Baltimore lowest @ 38.5%
  • France does some things right: high speed rail, 80% nuclear powered electricity … and some things wrong: minimum work for maximum pay mindset
  • Over half of Americans own stock … over 8 million paid capital gains taxes in 2006
  • Social security tax rate = 12.4% (ouch) … split between employee and employer … currently capped at about $100k … Obama’s “tax & redistribute” plan: 12.4% from zero to $100k, and over $250k

Newt on Leadership (credit to Peter Drucker)

Values > Vision > Metrics > Strategies > Projects > Tasks

First, win agreement … then win the vote
Win agreement by saying “yes, if…” rather than “no, because …”

Reward the efforts & success of “contributors” … don’t penalize it 

Newt’s formula for change

Homeland security – the highest priority

English –  the official language … preserve American history & culture·        

Free market education: charter schools and vouchers … maybe even paying students for good grades
  
“Free choice” flat tax (17%) … eliminate taxes on capital gains, dividends, pensions & social security, and death … allow choice to continue deductions system
   
Immigration: close the borders, guest worker program aggressive assimilation 
        
Trial lawyers, civil litigation: losers pay costs, class action limits
     
Direct ownership: homes, retirement accounts
        
Balanced budget: to force hard choices, eliminate earmarks & pork-barrel spending, cut future burden
        
Energy: drill here now, nuclear, incentives for renewables  

Heath care: more personal ‘choose and pay’ (vs 3rd party – insurers and gov’t) electronic records (e-prescriptions), personal responsibility – prevention, restrictions on trial lawyers 

Ken’s Take: Quick read … not much new, insightful, provocative
                             … borrow it, don’t buy it.

Our Family …

June 19, 2008

Jess, Scott, Meg, Jay, Kathy & Ken
Jay & Meg’s Wedding – May 31, 2008

Kicking it off …

June 16, 2008

Some of my former students suggested that I start a blog with current thinking on marketing issues and views on the world.  

My first message to them: Be careful what you wish for …

KEH