Archive for August, 2008

Number of uninsureds down … not up !

August 29, 2008

Excerpted from USA TODAY, “Census: Uninsured total shrank, incomes rose in 2007”,  Aug. 28, 2008

* * * * *

The number of people without health insurance dropped 1.3 million to 45.7 million. The uninsured fell to 15.3% from 15.8%. The primary reason for decline: More people, especially children, are covered by government-sponsored insurance.

* * * * *

Median household income rose to $50,233 in 2007 after adjusting for inflation. That’s $665 more than a year earlier but still below the peak of 1999. Income in black households rose for the first time since 1999.

Democratic candidate Barack Obama said, “Today’s news confirms what America’s struggling families already know — that over the past seven years, our economy has moved backwards.”

* * * * *

Full article:
http://usatoday.printthis.clickability.com/pt/cpt?action=cpt&title=Census%3A+Uninsured+total+shrank%2C+incomes+rose+in+2007+-+USATODAY.com&expire=&urlID=30607054&fb=Y&url=http%3A%2F%2Fwww.usatoday.com%2Fnews%2Fnation%2Fcensus%2F2008-08-26-census-poverty_N.htm&partnerID=1660

* * * * *

Note: See post “From Clinton to Bush, median real after-tax income is up !” ….  Watch for details re: uninsureds next week.

* * * * *

Want more from the Homa Files?
Click link =>
  The Homa Files Blog

* * * * *

Update: Based on data released this week, it’s official … From Clinton to Bush, after-tax household income is up !

August 29, 2008

In a prior post, I outlined an analysis that showed median real after-tax household income increased from 2000 (the last year of the Clinton presidency) to 2006 (the latest available data).

As luck would have it, the Commerce Dept released 2007 data immediately after my post.  Coincidence?

Median real household income increased in 2007 — for the 3rd consecutive year —  strengthening the argument.

Below is an updated summary of the analysis.

* * * * *

From Clinton to Bush, after-tax household income is up !

It’s bipartisan: all politicians use economic data selectively to make their cases.

Senator Obama has been claiming that median real household income grew under President Clinton, and fell by over $1,000 because of President Bush’s policies. 

Recently reported data from the Commerce Department takes some of the wind out of Obama’s sails. Median real household income increased in 2007 – for the third consecutive year – to $50,223. That compares to an inflation-adjusted $50,553 in 2000 – the last full year of the Clinton era. So, there is, in fact, a decline — $330 or roughly ½ of 1 %. Advantage Obama.

But, median real household income is an incomplete and misleading measure of families’ economic well-being. It doesn’t include some items that contribute to household income and, most important, it doesn’t reflect the impact of income taxes. 

Specifically, Obama’s selected measure of household income — technically called  “money income” — doesn’t include common sources of income such as capital gains.  Based on Tax Federation estimates, when capital gains are counted, the median real household income gap more than goes away.

Even more important, the median real household income measure is misleading because it is pre-tax

Since families can only spend after-tax income,  it is somewhere between disingenuous and intellectually dishonest to ignore tax benefits in year-to-year comparisons.  This is particularly true in this case since the core of the Bush economic program is lower taxes. 

While the Bush tax plan is often demonized as being just for the rich, it also includes substantial benefits for folks in the lowest tax brackets.  For example,  the low bracket marginal income tax rate was cut from 15% to 10% , the personal exemption allowance was increased from $2,900 in 2000 to $3,400 in 2007, and  the standard deduction was increased from $7,350 in 2000 to $10,700 in 2007 (for joint filing married couples).

Median after-tax real household can be estimated by simply running the reported median real household income through each year’s tax tables. 

In 2000, nominal median household money income — unadjusted for inflation — was $41,990.  The Tax Foundation estimates that household capital gains in 2000 were $680, so nominal median household income (including capital gains) was $42,670.

There were an average of 2.6 people per household in 2000, so the estimated allowance for personal exemptions is $7,540 — 2.6 times the $2,900 allowance per personal exemption in 2000.

The standard deduction for married couples filing jointly in 2000 was $7,350 . Subtracting the personal exemptions allowance ($7,540) and the standard deduction ($7,350 ) from the median nominal household income ($42,670),  nets to a taxable income of $27,780. That amount would have fallen within the 15% marginal tax bracket in 2000, so the corresponding income tax liability is $4,167 and estimated median nominal after tax income is $38,503 — $42,670 pre-tax income less $4,167 in taxes. Adjusting for inflation — that is, expressing the answer in 2007 dollars –  estimated median real household after-tax income in 2000 is $46,354.

How does 2007’s median real household after-tax median income rack-up against 2000’s ?

Well, taking into account Bush’s higher personal exemption allowance, the higher standard deduction, and the lower marginal tax rate — the answer reverses.  

Estimated 2007 median real after-tax household income is $47,367. So, from the end of the Clinton administration in 2000 to the latest reported data, median real after-tax household income went up over 2%  – about $1,000 per household. The opposite of Senator Obama’s claim.

Some folks are already saying that 2007 data points aren’t relevant since the economy is in a slump. That argument carries less sway since recent reports that GDP grew by an estimated 3.3% second quarter of 2008.

The bottom-line: real after-tax household income went up between 2000 and 2007, and for Senator Obama’s to continue making claims to the contrary is, in the best light, deceptive.

* * * * *

image

* * * * *

Want more from the Homa Files?
Click link =>
  The Homa Files Blog

* * * * *

News: Median household income up in 2007 … again !

August 28, 2008

Based on Census data released by the Department of Commerce
August 27, 2008:

Between 2006 and 2007, real median household income rose 1.3 percent, from $49,568 to $50,233 —a level not statistically different from the 1999 pre-recession income peak.

This was the third annual increase in real median household income.

image

* * * * *

Income inequality decreased between 2006 and 2007, as measured
by the shares of aggregate household income by quintiles.

* * * * *

Published in  “Income, Poverty, and Health Insurance Coverage in the United States: 2007”, U.S. Department of Commerce, Economics and Statistics Administration

Full report:
http://www.census.gov/prod/2008pubs/p60-235.pdf

* * * * *

Note: The analysis I posted earlier today — showing that after-tax median household income increased from Clinton to Bush –was based on 2006 data.  I’ll post the 2000 to 2007 after-tax analysis in the next couple of days

* * * * *

Want more from the Homa Files?
Click link =>
  The Homa Files Blog

* * * * *

From Clinton to Bush, after-tax household income is up !

August 28, 2008

One thing is definitely bipartisan: all politicians take liberties with economic data and use it selectively to make their cases.

Most recently, Senator Obama has been stumping that median real household income grew under President Clinton, and fell by over $1,000 because of President Bush’s policies. 

Taken literally, that’s true.  Reported median real household income declined from $49,163 in 2000 (Clinton’s last year in office) to $48,201 in 2006 (the most recently available data).

image
http://www.heritage.org/research/features/BudgetChartBook/index.html

Now, some folks (i.e. Republicans) might argue that the Clinton years’ gains were more attributable to the harvesting of the Reagan tax cuts and a coincidental internet-technology boom.  And, some folks (again, Republicans) might point out that Clinton handed Bush an economy that was, by generally accepted measures, in a the early stages of a recession that was subsequently deepened by the 9/11 crisis and its aftermath.  So, some of Clinton’s apparent gains may have been windfalls, and Bush may have been dealt a bad opening hand.  So be it.  That’s life in the oval office.

image 
http://www.heritage.org/research/features/BudgetChartBook/index.html

* * * * *

Putting aside the debatable qualitative aspects of the change in median real household income, what does the underlying hard data say ?

Starting from the very top, aggregate real income — the total income across all households, adjusted for inflation — grew 6.7%  from 2000 to 2006 — going from $7.2 trillion to $7.7 trillion. During that same period, the U.S. population grew 6.4%  — from  281.4 million  in 2000 to 299.4 million in 2006.  So, doing some simple arithmetic, real income per capita was flat from 2000 to 2006 — $25,722 to $25,795.  In other words, real income kept pace with population growth.

During that same period, the number of households grew 7.2%  — faster than population — going from 108.2 million in 2000 to 116.0 million in 2006.  Households got slightly smaller  — 2.58  people per household in 2006, versus 2.60 in 2000.  Why?  Some couples had fewer children, and some households split-up with multiple wage earners forming separate household units.

So, despite an increase in aggregate real income, the average —  mean real household income — declined slightly , going from $66,895 to $66,570. 

image

* * * * *

Importantly, for several reasons, mean real household income isn’t a particularly good criteria.  It is an incomplete and misleading measure of families’ economic well-being.

First, most analysts would agree that when statistical distributions are highly skewed (such as income data with many folks at the bottom and relatively few at the very top), the median  — the 50th percentile mark that splits the population into a top  and a bottom halves —  is a more representative measure than the mean, which is a simple average of all folks. 

So, from a strictly statistical perspective, it makes sense that Obama is touting a median.  The criteria he selects is median real household income — which  dropped from $49,163 in 2000 to $48,201 in 2006.

But, that narrow metric has some glaring flaws: It doesn’t include some items that contribute to household income and, most important, it is pre-tax.  It doesn’t account for  the taxes that the government takes out.

More specifically, median real household income isn’t all inclusive.  The commonly reported measure of household income — the one Obama cites —  is what’s called  “money income” — i.e., wages and transfer payments.  Money income doesn’t include common income items such as capital gains.  By just including capital gains, the median real household income gap between 2000 and 2006 narrows by a third.


image 
Note: Capital gains data is from Tax Foundation estimates:
http://www.taxfoundation.org/blog/show/23411.html

* * * * *

And, even more important, the median real household income metric is pre-tax

Since families can only spend after-tax income,  it is somewhere between disingenuous and intellectually dishonest to ignore tax benefits inyear-to-year comparisons.  This is particularly true in this case since the core of the Bush economic program is lower taxes. 

While the Bush tax plan is often demonized as being just for the rich, it also includes substantial benefits for folks in the lowest tax brackets.  For example,  the low bracket marginal income tax rate was cut from 15% to 10% , the personal exemption allowance has been increased from $2,900 in 2000  to $3,300 in 2006, and  the standard deduction has been increased from $10,200 in 2000 to $13,000 in 2006 (for joint filing married couples).

Median after-tax real household income isn’t commonly reported.  But, it can be estimated by simply running the reported median real household income through each year’s tax tables. 

In 2000, nominal median household money income — unadjusted for inflation — was $41,990.  Estimated nominal household capital gains were $680, so nominal median household income (including capital gains) was $42,670.

Since there were an average of 2.6 people per household in 2000, the estimated allowance for personal exemptions would be $7,540 — 2.6 times the $2,900 allowance per personal exemption in 2000.

The standard deduction for married couples filing jointly in 2000 was $10,200. Subtracting the personal exemptions allowance ($7,540) and the standard deduction ($10,200) from the median nominal household income ($42,670),  nets to a taxable income of $24,930. 

Since $24,930 was within the 15% marginal tax bracket in 2000, income taxes — ignoring, for simplicity, any child or earned income tax credits –would be $3,740  and median nominal after tax income would be $38,931.

Adjusting for inflation — that is, expressing the answer in 2006 dollars —  estimated median real household after-tax median income would be $45,581.

image

* * * * *

How does 2006’s median real household after-tax median income rack-up against 2000’s ?

Well, taking into account Bush’s higher personal exemption allowance, the higher standard deduction, and the lower marginal tax rate — 10% versus 15% — the answer reverses !   Median real after-tax household income went up 2%  — about 2% or $1,000 per household — from the end of the Clinton administration in 2000 to the latest reported data (2006). 

For sure, that puts a different paint job on the picture.

image

Note: An excellent  analysis by Gerald Prante of the  Tax Foundation — “Has Real Median Household Income Fallen Since 2000?”  —  traces through the inclusion or exclusion of other income adjustments.  For example, including the imputed value of employer paid health insurance increases the 2006 real advantage by over $700 per household; payroll taxes on the higher income reduces the 2006 advantage by about $200.
 http://www.taxfoundation.org/blog/show/23411.html

* * * * *

Now, some folks  (Democrats) might say that 2006 isn’t relevant since the economy has been in a slump since then. True, but the effect probably isn’t enough to re-reverse the answer.  We’ll see when the data comes out. 

Until then the most reasonable fact-based conclusion is that median real after-tax household income went up between 2000 and 2006, and Senator Obama’s claims are, in their best light, misleading.

* * * * *

Want more from the Homa Files?
Click link =>
  The Homa Files Blog

* * * * *

The true value of campaign promises …

August 28, 2008

Excerpted from Foreign Affairs, “The Next President’s Daunting Agenda”, by Richard Holbrooke, September/October 2008 

* * * * *

It is a well-established historical fact that what candidates say about foreign policy is not always … what they will do if elected. Historians point to a myriad of examples:

  • Franklin Roosevelt’s 1940 promise to not send “your boys . . . into any foreign wars,”
  • Lyndon Johnson’s statements in 1964 that he would not send ground troops to Vietnam,
  • Jimmy Carter’s 1976 campaign pledge to withdraw all U.S. ground troops from South KoreaRichard Nixon’s 1968 references to a nonexistent “secret plan” to get out of Vietnam,
  • Ronald Reagan’s 1980 pledge to upgrade U.S. relations with Taiwan to “official” status,
  • Bill Clinton’s 1992 promises to stand up to the “butchers of Beijing,”
  • George W. Bush’s 2000 call for a “more humble” foreign policy that would never again have the United States involved in “nation building.”

* * * * *

Whatever their ultimate fate, however, campaign positions are key indicators of the priorities and thinking of each candidate as he approaches the most powerful and difficult job in the world. It is therefore valuable to examine them carefully.

* * * * *

Richard Holbrooke was U.S. Ambassador to the United Nations from 1999 to 2001

Full article:
http://www.realclearpolitics.com/articles/2008/08/the_next_presidents_daunting_a.html

* * * * *

Want more from the Homa Files?
Click link =>
  The Homa Files Blog

* * * * *

The sweet congressional retirement plan …

August 28, 2008

I’ve always wondered what retired members of the Congress and Senate got to live on when they retired.  Here’s the scoop:

* * * * *

Members of Congress are eligible for a pension at age 62 if they have completed at least five years of service. (Certain partial pay early options are also available)

The amount of the pension depends on years of service, an accrual rate (2.5%), and the average of the highest three years of salary.

For example, after 30 years of Congressional service and a high-3 average salary of $161,800, the initial annual Civil Service Retirement System (CSRS) pension for a Member who retired in December 2006 at the end of the 109th Congress would be: 
                $161,800 x 30 x .025 = $121,350

Federal law limits the maximum CSRS pension that may be paid at the start of retirement to 80% of the Member’s final annual salary

The average annual pension for members of Congress who have retired under CSRS is $52,464.

Note: It’s unclear whether the qualifier is Congressional Service or civilian government service … both terms are used.

* * * * *

Source:
http://www.senate.gov/reference/common/faq/retirement_for_members.shtml

* * * * *

Want more from the Homa Files?
Click link =>
  The Homa Files Blog

* * * * *

Big oil getting out of low-margin retail …

August 28, 2008

Excerpted from WSJ, “Conoco Plans To Sell Rest of Its Gas Stations”, August 27, 2008

This year, gasoline retailers experienced some of the worst profit margins on record.

Retail gasoline-sales are undergoing dramatic change. Giants such as ConocoPhillips and Exxon Mobil and BP have announced plans to sell or close their retail gasoline outlets.

Now, ConocoPhillips has announced that it will sell the remainder of its 600 company-owned gasoline stations . 

The sale is part of oil companies’ efforts to flee low-margin U.S. retail-gasoline sales and focus on finding new supplies of crude oil.

ConocoPhillips will continue to refine oil into gasoline and sell fuel on a wholesale basis to stations..

Few gas-station owners generate the majority of their income from selling gasoline. Profits come from getting drivers to buy other goods and services, such as food and car washes.

Seattle-based PetroSun West plans to add fresh sandwiches, financial services such as bill-paying, and even dry cleaning, Most of the stations it is buying are located in urban, high-traffic areas along the West Coast, from Seattle to Los Angeles.

Full article:
http://online.wsj.com/article/SB121978249439473837.html?mod=hps_us_whats_news

* * * * *

Want more from the Homa Files?
Click link =>
  The Homa Files Blog

* * * * *

Energy – Why do gas prices move up and down ?

August 27, 2008

In last week’s post “Thinking about $4 per gallon gas”, I wondered why oil companies waited so long to push prices up to $4 — the apparent price that the market will bear — and why they don’t just let the price stick at $4 now that it has been tested.

Chris Hairel , MSB MBA alum, emailed a nice recap of the oil to gas value chain.

Bottom line: cost-plus pricing in a very competitive market.

Worth reading …

* * * * *

The downstream refined products value chain — from crude oil to retail gasoline and other oil-based products — has six segments, each with its own unique industry structure, pricing levers and regulation:

* * * * *

Refineries – the key asset in the business where the object is to maximize the economic value added of the refined products.

Refineries are basically price takers since their company trading group supplies them with crude oil and the projected prices for refined products.

Working with the trading group, the refinery is charged with turning that crude oil into the most profitable collection of products given the quality of the crude and the capabilities of the refinery.

* * * * *

Bulk Markets – The trading group assumes title of the product as it leaves the refinery and arranges transportation to the terminals based on projected demand in the rack (or wholesale market).

Along the way the traders seek to increase the realized price for their products, react to supply disruptions or unexpected demand.

Bulk is a relatively efficient market with good price transparency based on key trading hubs like New York Harbor, Houston and Chicago.

The NYMEX futures market provides a facility for hedging and for paper speculation. Trading parties include oil companies, major users of petroleum products, independent pipeline companies and speculators.

Pricing is market-based and profit-optimized by the traders.

* * * * *

Pipelines – Interstate pipelines with multiple customers are regulated by the Federal Energy Regulatory Commission .

Their tariffs (i.e. prices) are set based on a government sanctioned rate of return. So. pricing is essentially a cost-plus process.

Pipeline owners are not permitted to share information about who else is using the pipeline with their affiliated companies, nor can they give (or take) preferential treatment with respect to supply allocation or delivery scheduling.

* * * * *

Rack Markets and Terminals – Rack markets cover the wholesale market for a city.

Prices in rack markets are set daily for the next day. The marketing group for an oil company looks at demand by channel of trade (i.e. branded, unbranded, spot), recent price history in the area and the supply situation.

The pricing mechanism itself may be based on an index, a cost plus or other model, but there’s some leeway on the decision under certain circumstances. For example, pricing is actually used as a key demand management lever since companies can purposefully price themselves out of the spot or unbranded channel in order to save product for branded customers.

Despite what the pricers do, most transaction pricing  is determined by long term contracts. These contracts usually allow customers to “swing” their volumes. A customer may commit to buying an average of 5,000 gal a day, but the contract management process will look at the monthly volume and divide by 30 – the customer can usually manage their buying pattern to buy more on days when gas is cheap and less when it’s more expensive. .

* * * * *

Secondary Transportation – These are the tanker trucks that move product from the terminal to the retail station. The logistics are typically handled by jobbers or independent marketers that almost always price on a cost-plus basis.

* * * * *

Retail – Retail gas stations typically price on a cost-plus basis with a slim retail margin added on.

The bulk oil stations’ profits isn’t from the gasoline !  Gas is simply the “leader” product that attracts traffic (literally) which often loads up with high margin coffee, soda, cigarettes, etc.

* * * * *

Retail gasoline prices

Retail gasoline prices tend to respond quickly to market forces for 3 reasons: (1) cost-plus pricing, (2) retail competition, and (3) fear of government intervention.

* * * * *

(1) Cost-plus pricing

Since cost-plus pricing is prevalent at all stages of the value chain, refined products’ prices and crude oil prices tend to move together.

Refiners’ margins are often forecasted using what’s called the 3-2-1 spread. Take the price difference between three WTI NYMEX contracts and the sum of two NYMEX gasoline contracts plus one heating oil contract – then trade accordingly.

When crude falls. the entire complex floats down with it since the bulk market is fairly efficient and the downstream segments all use a cost-plus pricing model.

If domestic bulk markets fail to react to lower crude prices, several large players can bring product in from Europe to capture the arbitrage.

Since the vast majority of transactions are priced on a cost-plus basis, companies compete on their ability to “buy right”,  on the efficiency of their operations, and their opportunity for more profitable ancillary sales. .

* * * * *

(2) Retail CompetitionFew prices are signaled to potential customers more visibly than gasoline prices.

There are often 2 or 3 gas stations on a corner,  so consumers are tempted to chose the cheapest one even if it’s only a cent or two cheaper per gallon. The conventional wisdom is that brand loyalty is low. 

The same price pressures evident in the wholesale rack markets since unbranded retailers have the option of buying from multiple terminals. If Shell is less expensive than Exxon on a particular day, Shell gets the sale in the unbranded and spot channels of trade.

* * * * *

(3) Threat of Regulation

A third force is the threat of government action.Pricing through the entire oil value chain is very transparent.  Timely price data available from multiple sources for every segment of the market (DOE data, NYMEX, bulletin board exchanges, broker quotes, daily PLATT and OPUS surveys, AAA retail surveys, etc.).Oil companies generate two-thirds of their profits from crude oil production and refining. The wholesale and retail marketing and distribution parts of the business is generally considered mote of a cost of going business (i.e. overhead) than a profits source.  So, oil companies would rather play it safe (from government regulators) than try to eek out an extra half percentage point of profit at the wholesale or retail level.

* * * * *

Want more from the Homa Files?
Click link =>
  The Homa Files Blog

* * * * *

The Heart of the Economic Mess

August 27, 2008

A liberal view xcerpted from Former Labor Secretayrt bert Reich’s blog 07-25-08:

Most Americans can no longer maintain their standard of living. The only lasting remedy is to improve their standard of living by widening the circle of prosperity.

The basic reality is this: For most Americans, earnings have not kept up with the cost of living …  they are barely higher than they were in the mid-1970s, adjusted for inflation. The income of a man in his 30s is now 12 percent below that of a man his age three decades ago.

This underlying earnings problem has been masked for years as middle- and lower-income Americans found coping mechanisms to live beyond their paychecks:

 The the first coping mechanism was to send more women into paid work … to prop up family incomes. The percentage of American working mothers with school-age children has almost doubled since 1970 — to more than 70 percent.

A second way:  They worked more hours. The typical American now works more than … three decades ago … putting in 350 more hours a year than the average European, more even than the notoriously industrious Japanese.

A third coping mechanism:  They began to borrow …  they turned their homes into piggy banks by refinancing home mortgages and taking out home-equity loans … Now, with the bursting of the housing bubble, the piggy banks are closing.

As a result, typical Americans have run out of coping mechanisms to keep up their standard of living. That means there’s not enough purhasing power in the economy to buy all the goods and services it’s producing. We’re finally reaping the whirlwind of widening inequality and ever more concentrated wealth.

The only way to keep the economy going over the long run is to increase the real earnings of middle and lower-middle class Americans. The answer is not to protect jobs through trade protection … Nor is the answer to give tax breaks to the very wealthy and to giant corporations in the hope they will trickle down to everyone else. We’ve tried that and it hasn’t worked. Nothing has trickled down.

We must … adopt (more) progressive taxes at the federal, state, and local levels. In other words, we must rebuild the American economy from the bottom up. It cannot be rebuilt from the top down.

* * * * *

Want more from the Homa Files?
 
Click link =>  The Homa Files Blog

* * * * *

Just two middle class guys, right ?

August 26, 2008

Just for yuks, here are the candidates most recent financials. 

McCain says it’s all his wife’s money, and what she does with her money is none of our business.  Hmmm.

Obama says he felt the middle class pain until the book deal. 

Question: Don’t Obama’s record high earnings fall into the category of a “windfall”, and shouldn’t his tax rate be at least as high as Exxon’s?

* * * * *

Mccain_tax_returns
http://taxprof.typepad.com/taxprof_blog/2008/04/mccain-releases.html

* * * * *

Obama_tax_returns_2
http://taxprof.typepad.com/taxprof_blog/2008/03/obama-releases.html

* * * * *

Senator and Mrs. McCain have kept their personal finances separate throughout their 27-year marriage. Accordingly, they have for many years filed separate tax returns. However, their home state of Arizona is a community property jurisdiction.  In community property states, individuals maintain a separation of all property brought to the marriage, or inherited during it, but share financial responsibility for other assets acquired through the efforts of each spouse during the marriage. This means that their tax returns report one half of each of their community property income and expenses (such as income each of them earn as salaries, Senator McCain’s book royalties, and expenses attributable to both of them such as charitable contributions from community assets).

http://www.johnmccain.com/mccainfinancial/

* * * * *

Want more from the Homa Files?
Click link =>
  The Homa Files Blog

* * * * *

Campaign: Why It’ll Be Mitt …

August 26, 2008

Romney has the experience — in business, in government.  But, he’s flip-flopped on abortion rights … and, did I mention that he’s a Mormon ?

While pundits say his religious affiliation is a big negative, I disagree.

It has nothing to do with theology.  It has everything to do with demographics and logistics.

Obama will take over 90% the African-American vote (unless McCain lands Colin Powell, in which case, all bets are off).  But, there are relatively few states where Obama’s segment-domination will matter — since most of the states are solidly Democratic anyway.

While the Mormon population is smaller, and concentrated in a few states, some are battleground states that can potentially swing the election: Nevada. Montana, Colorado, New Mexico.  And, there are “statistically significant” Mormon populations in Hawaii, Oregon, Washington — which could conceivably be thrown back into play.

The Mormons are legendary for their focused zeal and executional discipline — as evidenced by their missionary effectiveness.  Can you imagine if that force is thrown behind a get out the vote effort in a few swing states?

And, did I mention Michigan ?

* * * * *

image

* * * * *

Source : http://www.electoral-vote.com/

image

* * * * *

Want more from the Homa Files?
Click link =>
  The Homa Files Blog

* * * * *

Taxes – Middle class cuts or hikes ?

August 26, 2008

Excerpted from IBD, “Obama’s Tax Hikes”, August 22, 2008

When Bill Clinton ran for president in 1992, the centerpiece of his much-touted economic plan was a middle-class tax cut. Once elected, he announced that the deficit was bigger than he thought, so no tax cuts.

Writing in the Wall Street Journal earlier this month, Obama economic advisers Jason Furman and Austan Goolsbee promised: “The Obama plan would cut taxes for 95% of workers and their families with a tax cut of $500 for workers or $1,000 for working couples” on top of “tax cuts for low- and middle-income seniors, homeowners, the uninsured, and families sending a child to college or looking to save and accumulate wealth.”

But what’s touted as tax-cutting hides tax increases for the middle class. According to the American Enterprise Institute’s … “Senator Obama’s proposed ‘tax cuts for the middle class’ are actually marginal rate hikes in disguise.”

The increase happens because Obama phases out the child and dependent-care credit for one-child families in the $30,000-to-$58,000 income range … and because of changes planned for Bill Clinton’s Hope Scholarship Tax Credit.

An “Economists for Obama” Web site calls the AEI findings “deeply dishonest” because their examples (are) “cherry-picked.” AEI responds that Obama’s use of refundability and phase-outs means that “any example will show these kinds of disincentive effects.”

Full article:
http://www.ibdeditorials.com/IBDArticles.aspx?id=304297643560219#

* * * * *

Want more from the Homa Files?
Click link =>
  The Homa Files Blog

* * * * *

A nuanced definition of what’s "rich" …

August 25, 2008

I think that both candidates gave pretty good answers to Rick Warren’s question at Saddleback.

McCain is getting hammered for his $5 million joke (which Paul Krugman of the NY Times acknowledges was a joke).

Going beyond the sound bites and reading the transcript (below), it turns out that it was McCain, not Obama, who gave the more nuanced answer.  Hmmm.

* * * * *

Obama’s  Answer:

REV. WARREN: Okay. Taxes — this is a real simple question. Define “rich.” (Laughter.) I mean, give me a number. Is it 50,000 (dollars)? One hundred thousand (dollars)? Two hundred thousand (dollars)? Everybody keeps talking about who we’re going to tax. How do you define that?

SEN. OBAMA: You know, if you’ve got book sales of 25 million, then you qualify. (Applause.)

REV. WARREN: (Laughs.) I’m not asking about me. (Laughter.)

SEN. OBAMA: Look, here’s how I think about it. Here’s how I think about it, and this is reflected in my tax plan. If you are making $150,000 a year or less as a family, then you’re middle class, or you may be poor. But 150 (thousand dollars) down, you’re basically middle class. Obviously, it depends on region and where you’re living.

REV. WARREN: In this region, you’re poor. (Laughter and applause.)

SEN. OBAMA: I don’t know what housing prices are doing lately. (Applause.) I would argue that if you’re making more than 250,000 (dollars) then you’re in the top 3, 4 percent of this country. You’re doing well. Now, these things are all relative, and I’m not suggesting that everybody who is making over 250,000 (dollars) is living on Easy Street.

* * * * *

McCain’s  Answer:

REV. WARREN: Okay, on taxes, define “rich.” Everybody talks about, you know, taxing the rich but not the poor, the middle class. At what point — give me a number. Give me a specific number. Where do you move from middle class to rich? Is it $100,000? Is it $50,000? Is it $200,000? How does anybody know if we don’t know what the standards are?

SEN. MCCAIN: Some of the richest people I’ve ever known in my life are the most unhappy. I think that rich should be defined by a home, a good job, an education, and the ability to hand to our children a more prosperous and safer world than the one that we inherited.

I don’t want to take any money from the rich. I want everybody to get rich. (Laughter.) I don’t believe in class warfare or redistribution of wealth. But I can tell you, for example, there are small businessmen and women who are working 16 hours a day, seven days a week, that some people would classify as, quote, “rich,” my friends, and want to raise their taxes and want to raise their payroll taxes.

Let’s have — keep taxes low. Let’s give every family in America a $7,000 tax credit for every child they have. Let’s give them a $5,000 refundable tax credit to go out and get the health insurance of their choice. Let’s not have the government take over the health care system in America. (Applause.)

So I think if you’re just talking about income, how about $5 million? (Laughter.) So, no, but seriously, I don’t think you can — I don’t think, seriously, that — the point is that I’m trying to make here, seriously — and I’m sure that comment will be distorted — (laughter) — but the point is, the point is, the point is that we want to keep people’s taxes low and increase revenues.

* * * * *

Technical note: Obama’s 25 million books line (also a joke) is getting a free pass — even though, at $5 per copy, they represent $125 million in income — which is equivalent to $5 million amortized over 25 years.  Hmmm.  Did the candidates jokingly say the same thing ?

* * * * *

Full debate transcript:
http://www.clipsandcomment.com/2008/08/17/full-transcript-saddleback-presidential-forum-sen-barack-obama-john-mccain-moderated-by-rick-warren/

Video:
http://trevinwax.com/2008/08/17/obama-mccain-with-rick-warren-at-saddleback-forum-video/

* * * * *

Want more from the Homa Files?
Click link =>
  The Homa Files Blog

* * * * *

Academia: You can’t make this stuff up …

August 25, 2008

At the University of Memphis there is an Arthur Andersen Chair of Excellence in Accountancy.

At West Virginia University there is a Kmart chair of marketing.

* * * * *

Source: WSJ, “We’re Not All Friedmanites Now”, August 20, 2008
http://online.wsj.com/article/fighting_words.html

* * * * *

Want more from the Homa Files?
Click link =>
  The Homa Files Blog

* * * * *

Taxes – The "Denizens of Richistan"

August 25, 2008

I never agree with ultra-liberal NY Times ranter Paul Krugman. Well, I guess I should never say never.

While I disagree with his conclusions, I think he provides some interesting perspective in this op-ed.

* * * * *

Excerpted from NY Time’s Op-Ed,  “Now That’s Rich”, Paul Krugman, August 22, 2008

Last weekend, Pastor Rick Warren asked both presidential candidates to define the income at which “you move from middle class to rich.”

Mr. Obama answered the question seriously, defining middle class as meaning an income below $150,000.

Mr. McCain, at first, made it into a joke, saying “how about $5 million?” .

The real problem, however, was with the question itself.

When we think about the middle class, we tend to think of Americans whose lives are decent but not luxurious: they have houses, cars and health insurance, but they still worry about making ends meet, especially when the time comes to send the kids to college.

Meanwhile, when we think about the rich, we tend to think about the handful of people who are really, really rich — people with servants, people with so much money that, like Mr. McCain, they don’t know how many houses they own.

The trouble with Mr. Warren’s question was that it seemed to imply that everyone except the poor belongs to one of these two categories: either you’re clearly rich, or you’re an ordinary member of the middle class. And that’s just wrong.

In his entertaining book “Richistan,” Robert Frank of The Wall Street Journal declares … that country is divided into levels, and only the inhabitants of upper Richistan live like aristocrats; the inhabitants of middle Richistan lead ample but not gilded lives; and lower Richistanis live in McMansions, drive around in S.U.V.’s, and are likely to think of themselves as “affluent” rather than rich.

Even these arguably not-rich, however, live in a different financial universe from that inhabited by ordinary members of the middle class: they have lots of disposable income after paying for the essentials, and they don’t lose sleep over expenses, like insurance co-pays and tuition bills, that can seem daunting to many working American families.

Which brings us to the dispute about tax policy.

According to estimates prepared by the nonpartisan Tax Policy Center, those Obama tax increases would fall overwhelmingly on people with incomes of more than $200,000 a year. Are such people rich? Well, maybe not: some of those Mr. Obama proposes taxing are only denizens of lower Richistan, although the really big tax increases would fall on upper Richistan.

* * * *

Full op-ed:
http://www.nytimes.com/2008/08/22/opinion/22krugman.html?_r=1&oref=slogin&pagewanted=print

* * * * *

Want more from the Homa Files?
Click link =>
  The Homa Files Blog

* * * * *

Health Care: Uninsured Spend $30 Billion Out-of-Pocket … Total Tab $209 Billion

August 25, 2008

Excerpted from WSJ,  “Uninsured to Spend $30 Billion”,
August 25, 2008

Americans who lack health insurance will spend about $30 billion out of pocket on medical care this year, but others — mainly the government — will end up covering another $56 billion in costs … The tab to cover all the uninsured would be $208.6 billion — $122.6 billion more than this year’s projected total.

Health-care spending accounted for 16.3% of gross domestic product in 2007, or about $2.2 trillion

The government pays 75%, or $42.9 billion, of the amount uninsured patients can’t pay — through Medicaid, the federal-state health-insurance for the poor and Medicare, the federal program for the elderly and disabled, as well as state and local taxes.

Complicating the measure: Some doctors and hospitals donate time and forgo profit to cover poor people

While many have argued that uncompensated care will translate into higher premiums to patients with private insurance … the study reported that the impact is “very small,” noting that despite an increase in the number of uninsured, hospital spending on uncompensated care has been relatively stable. That is partly because the public hospitals and clinics that most often care for the uninsured often don’t have many privately insured patients to absorb the costs.

image

* * * * *

Full article:   http://online.wsj.com/article/SB121963245880668193.html?mod=hps_us_whats_news

* * * * *

Want more from the Homa Files?
Click link =>
  The Homa Files Blog

* * * * *

Energy – Thinking about $4 per gallon gas …

August 22, 2008

Most folks wonder why the pump price of gas surged this year.

I ask a different question: why didn’t the oil companies — branded by most folks as evil profit grubbers — push the price up into the $4 /gallon  range a year or two ago?

In my pricing course, I harp on a basic point: marketers should be respectful of costs (i.e. never sell stuff below “fully-loaded  cost” plus an acceptable profit), but they MUST price to the market.  That is,  they should determine the price that the market will bear, and then adjust accordingly to maximize profits — taking into account downward sloping demand curves and volume-related cost functions.

It’s starting to look like $4 per gallon gasoline  is about what the market will bear.  That’s the price point where folks started to cutback in gas consumption the past couple of months.

* * * * *

Question: Why did the oil companies wait for the cost of crude to push up gas prices? To me, it seems that the oil companies have actually showed restraint over the past couple of years.

* * * * *

Here’s a crude analysis (pun intended):

Simply divide the price of a barrel of crude over the past couple of years by 42 (since the are 42 gallons per barrel), and compare the result to the retail price of gasoline (which is usually expressed per gallon). 

The difference — gasoline’s “back of the envelope” mark-up over crude prices — is plotted below. 

Note that for the past 9 months, or so, the crude mark-up been about $1 per gallon — at the low end of the historical range.

image

* * * * *

Since the cost of a barrel of crude has skyrocketed over the past couple of years, the percentage mark-up has trended down. Hmmm.

image

* * * * *

Bottom Line:

It certainly looks like the oil companies price gasoline using some sort of  “cost plus” formula. 

I think the oil companies left a lot of profits on the table during the past couple of years — the retail gas market would probably have borne higher prices.

Now, I’m betting that retail gases will be “sticky” — there will be a “ratchet effect” and gas prices will come down proportionately slower than crude oil prices.

And, I predict that if the oil companies get hit with a windfall profits tax, they’ll just pass the tax along into retail gas prices.  Just watch.

* * * * *

Analytical note:

The “real” calculations re: the economics of converting crude oil  into gasoline are way more complicated than the above simple analysis (e.g. only about 1/2 of a barrel of crude is made into gasoline, there are refining and distribution costs, the 1/2 barrel that doesn’t go into gas earns other profits).

My bet: the conclusions drawn from a more precise analysis would be directionally the same, and probably pretty  close to the $1 per gallon — which has a certain memorable ring to it.

* * * * *

Want more from the Homa Files?
Click link =>
  The Homa Files Blog

* * * * *

Brands – Reviving those oldies but goodies …

August 22, 2008

Excerpted from NYT, “Those Shelved Brands Start to Look Tempting”, Aug. 21, 2008

During economic downturns, consumer products marketers takiw stock of brands they already own to see if any can be revived or renewed. It can cost significantly less to bring back a brand — or restore the luster to a faded one — than to develop a new product, because spending huge sums to generate awareness is not necessary.

For instance, in considering a comeback for Eagle snacks, research found that “6 out of 10 adults remember the brand” … Reserve Brands is reintroducing Eagle in stores and vending machines … plans to reintroduce Eagle include new snacks under names like Bursts and Poppers, to “modernize the brand and contemporize it.”

“It would take $300 million to $500 million to recreate that brand awareness today.”

Eagle is among scores of products that marketers abandoned because of declining sales, stronger competitors or a desire to focus on newer brands deemed more contemporary.

Marketers are also taking another look at products that are still in production but have been forgotten or neglected, known as ghost brands or orphan brands.

Makers of such products usually cut advertising budgets in the face of declining sales. That slows sales further, which leads to more budget cuts — creating a downward spiral, difficult to avoid, that can land a ghost or orphan in the netherworld of once-popular, now-deceased trademarks.  

To keep some of its venerable brands fresh — brands like Aleve, Alka-Seltzer, Bayer, Flintstones and One A Day vitamins, and Phillips’ Milk of Magnesia — Bayer HealthCare is pursuing a strategy … focused on “marketing innovation, product innovation and technology innovation.”

For instance, new advertising campaigns for Alka-Seltzer draw on its heritage while at the same time updating brand catch phrases like “I can’t believe I ate the whole thing” and “Try it; you’ll like it.”

There are also new products being brought out under the umbrella of the well-known brands, among them Alka-Seltzer Wake-Up Call, a hangover treatment, and Phillips’ Colon Health, a probiotic supplement in caplet form.

Other older brands may be ripe for revival because “as the population ages, there are certain brands that really resonate with consumers.”

* * * * *

Full article:
http://www.nytimes.com/2008/08/21/business/media/21adco.html?_r=2&adxnnl=1&oref=slogin&ref=business&adxnnlx=1219320567-FO5ND1sKBcpwsKMnC8H6nQ

* * * * *

Want more from the Homa Files?
Click link =>
  The Homa Files Blog

* * * * *

Sometimes the answer is "yes, sir" or "no, sir" …

August 21, 2008

Excerpted from WSJ, “Saddleback: The Inner Game of Politics”, August 21, 2008

* * * * *

The questions Pastor Rick Warren asked:  

Who are the three wisest people you know in your life?

What would be the greatest moral failure in your life?

What does it mean to you to trust in Christ?

What’s the toughest decision you ever had to make?

At what point does a baby get human rights?

Does evil exist?

What about stem cells?

What is your definition of marriage?

* * * * *
Barack Obama clearly has spent more time than is healthy around places like the law schools of Harvard and Chicago, where one learns that a short answer cannot exist.

At Annapolis, John McCain’s school, one learns the answer is often “Yes, sir” or No, sir.”

* * * * *

Ken’s POV: Worth considering when in a job interview … the benefits of clear, direct answers that reveal the “real you” … even if the interviewer doesn’t like the answer.

* * * * *

Full op-ed:
http://online.wsj.com/article/SB121927592113858497.html?mod=todays_columnists

* * * * *

Want more from the Homa Files?
Click link =>
  The Homa Files Blog

* * * * *

We can’t tax our way out of the problem …

August 21, 2008

Excerpted from WSJ, “We Can’t Tax Our Way Out of the Entitlement Crisis”, by R. Glenn Hubbard, August 21, 2008

The spending shortfalls in Social Security and Medicare are large.

According to the Congressional Budget Office, Social Security and Medicare spending left unchecked would, after a generation, consume about 10 percentage points more of GDP than it does today.

Simple arithmetic suggests that with this much more of GDP eaten up by the two programs, all federal taxes on average would have to be raised by more than 50% to make up the shortfall … such a tax increase would reduce long-term GDP growth by about a full percentage point … reversing all of the gains in our long-term growth rate from the productivity boom of the past 15 years.

Large entitlement budgets … cannot be financed with growth-chilling taxes alone. Spending on other areas, including defense but also education, research, etc., must also be adversely affected.

Mr. Obama’s fiscal …  vision is plain enough: a larger welfare state paid for by higher taxes …  leaving open the question of what tax increases are next.

If Mr. Obama is going to increase spending, will he raise the money by higher business taxes instead? He has already distanced himself from John McCain’s call to reduce America’s corporate tax rate, and he is committed to raising tax rates on successful small business owners who pay individual as opposed to corporate income taxes. Does this mean he will raise tax burdens on individuals with annual incomes less than $250,000?

In a June 26 interview  … Mr. Obama said he wanted to roll back the Bush tax cuts for those in the top 5% of incomes — that is, about $145,000 per year. He also voted for the Democrats’ fiscal year 2009 Budget Resolution, which would raise taxes on individuals earning $42,000 or more.

Balancing the federal budget without a tax increase is possible, but will require strong fiscal restraint.

Three actions are essential: (1) reduce entitlement spending growth through some form of means testing; (2) eliminate all nonessential spending in the rest of the budget; and (3) adopt policies that promote economic growth.

This 180-degree difference from Mr. Obama’s fiscal plan forms the basis of Sen. McCain’s priorities for spending, taxes and health care.

* * * * *

Mr. Hubbard, dean of Columbia University Business School, was chairman of the Council of Economic Advisers under President George W. Bush.

Full op-ed:
http://online.wsj.com/article/SB121927694295558513.html?mod=opinion_main_commentaries

* * * * *

Want more from the Homa Files?
Click link =>
  The Homa Files Blog

* * * * *

Pricing Tactics – To increase sales, just drop the dollar sign … huh?

August 21, 2008

Excerpted from WSJ online, “To Get Customers to Spend More, Drop the Dollar Signs”. August 18, 2008

Researchers at Cornell University found that restaurant owners who drop the dollar sign from their menus got clients to spend more — $5.55 more per meal on average, to be exact.

The researchers noted that just seeing the dollar symbol agitated diners so much that they spent less.

Something as simple as how you display prices can have an impact on customer perception and actual sales  …  like that penny-off trick to enhance perceived value  … $9.99  just seems less than 10 bucks.

Source:
http://blogs.wsj.com/independentstreet/2008/08/18/to-get-customers-to-spend-more-drop-the-dollar-signs/

* * * * *

Want more from the Homa Files?
Click link =>
  The Homa Files Blog

* * * * *

About pay grades …

August 20, 2008

Excerpted from the Boston Herald, “Pay grade — an unartful dodge”, by Michael Graham,  August 20, 2008 

“Well, uh, you know, I think that whether you’re looking at it from a theological perspective or, uh, a scientific perspective, uh, answering that question with specificity, uh, you know, is, is, uh, above my pay grade.” – Sen. Barack Obama, on “When does a baby get human rights?”

In 1948, they had Harry Truman and “The buck stops here!”

(In 2004 the got John Kerry and “I voted for it before I voted against it”.)

In 2008, they’ve got Barack Obama and it’s “above my pay grade.”

This is definitely not your grandfather’s Democratic Party.

My grandfather helped push Patton’s tanks across Europe, and one reason for my grandfather’s unshakable party loyalty was his belief that Harry Truman saved his life by dropping the A-bombs on Japan.

If Truman hadn’t made the call – if he’d demurred that such a profound life-and-death decision was “above my pay grade” – my grandfather believed that he and untold thousands of Americans would have died invading the Japanese mainland.

When Obama got the invitation to an evangelical forum hosted by a pro-life pastor, he had to know that issues regarding life and the law were going to come up.

And his prepared answer to the most fundamental question about public policy and abortion (“is the fetus a human being?”) is that it’s “above my pay grade?”

Among phrases that should never be spoken by a guy whose job it is to sit next to the Big, Red Button is “That’s above my pay grade.”

Leaders don’t pass tough questions to the next “pay grade.” They don’t need five minutes to answer yes-or-no questions.

That’s not leadership, that’s politics.

Full editorial:
http://www.bostonherald.com/news/opinion/op_ed/view.bg?articleid=1113869&format=&page=2&listingType=opi#articleFull

* * * * *

Want more from the Homa Files?
Click link =>
  The Homa Files Blog

* * * * *

OTP – Singing the blue state blues …

August 20, 2008

 OTP = Obama Tax Plan

An irony of Senator Obama’s tax plan is that folks in Democratic-leaning Blue electoral states will take the brunt of  proposed tax hikes. 

High-earners are concentrated   in big Democratic strongholds: DC, New Jersey, Maryland, Massachusetts, Connecticut, New York, California, and Illinois. 

Here are a couple of indicators of the level of concentration:

First, the average income of tax filers falling into the top 5% in each state.  As a rough measure, if the average is higher than Obama’s $200,000 – $250,000 income thresholds, then most (or all) of the state’s top 5% will be hit by the Senator’s increased tax rates.

image

* * * * *

A second view is the proportion of top 5% income represented by each state’s top 5%.  The top 10 states — 7 of which are Blue states –account for over 55% of the total.

image

* * * * *

Bottom line:  More Blue state filers than Red state filers will get hit by Obama’s tax increases.  And, there’s nothing they can do about it since their states are unwaveringly Democratic states.

Maybe there is justice in the world.

* * * * *

Source : http://www.electoral-vote.com/

image 

* * * * *

Want more from the Homa Files?
Click link =>
  The Homa Files Blog

* * * * *

Pricing – Airlines bring back "structural" price discrimination …

August 20, 2008

Excerpted from WSJ: “Airlines Revive Minimum Stays On Cheap Fares”, August 19, 2008

One of the craziest aspects of the airline business is that two passengers sitting side-by-side can pay vastly different fares for the same seat — sometimes hundreds of dollars.

Airlines contend business travelers buy a different product.

A business traveler pays more for a seat purchased close to departure because the airline has taken an economic risk to hold that inventory back. And business travelers pay more for tickets with fewer restrictions — you pay a lot for the ability to change or cancel.

* * * * *

Now, get ready for a wave of annoying airline rules requiring you to stay at your destination a minimum number of days or over a Saturday night — if you want the cheapest tickets.

The move is an effort to force (price insensitive) business travelers, who usually need the most flexibility and want to be home on the weekends, to pay more for their flights.

Airlines have increased restrictions on cheap fares by raising overnight requirements, upping what had commonly been only a one-night stay requirement to two and three nights.

Airlines tried to bring back Saturday-night stay requirements earlier this year.  For many years the Saturday-night requirement was a prime tactic airlines used to separate business travelers from leisure customers. The Saturday-night stay forced many business travelers to either pay hundreds of dollars more for each ticket, or to spend an extra night or two on the road to save money. If the choice was a $300 ticket or a $2,000 ticket, many companies would ask travelers to stay over Saturday night at a nice hotel, have a nice meal and still save hundreds.

But the change didn’t stick, mostly because discounters compete on so many routes these days … without onerous restrictions.

(So) business travelers see them as a more-viable alternative as the price gap widens in fares. If big airlines run their prices up too high by making discounted tickets unavailable to business travelers, they risk losing customers. That’s been the history, likely to repeat this fall.

Full article:
http://online.wsj.com/article_print/SB121909457563650833.html

* * * * *

Thanks to Justin Bates, MSB MBA for the heads-up.

* * * * *

Want more from the Homa Files?
Click link =>
  The Homa Files Blog

* * * * *

OTP – Clarifying the clarification …

August 19, 2008

OTP = Obama Tax Plan

Last week Forman & Goolsbee, Senator Obama’s key economic advisers “clarified” the candidate’s tax plan in a WSJ op-ed.

Obama web site:
www.barackobama.com/taxes

Article:
http://online.wsj.com/article_print/SB121867201724238901.html

* * * * *

I may just be in the slow reading group, but Forman & Goolsbee’s “clarification” raised more questions than it provided answers.

* * * * *

Consistent with their op-ed, the Barman web site says “The top two income tax brackets would return to  36% and 39.6%. All other tax brackets would remain as they are today. Obama would work with the Treasury Department to adjust the thresholds of these rates slightly to insure that no married couple making less than $250,000 (or single making less than $200,000) was affected by these changes.”

Currently, the 33% marginal tax bracket (which would go to 36% under Obama) starts at $200,300 for married couples filing jointly, $164,550 for individuals.  So, the “slight” threshold adjustments will need to be about 25% to get them to $250,000 and $200,000 respectively. Perhaps, that’s just a technical detail.  But, it  raises another question.

Since “all other tax brackets would remain as they are today”, families with taxable incomes between $164.550 and $200,000 will see their marginal tax rates drop  from 33% to 28%, or does Obama’s “simplified tax plan” introduce still one more marginal  tax bracket?

* * * * *

With respect to capital gains (and dividends), Obama’s web site says ” Families with incomes below $250,000 will continue to pay the capital gains rates that they pay today. For those in the top two income tax brackets – likewise adjusted to affect only families over $250,000 – Obama will create a new top capital gains rate of 20 percent.”

Perhaps I’m just quibbling over details, but exactly how will this work?

For example, say a family has $300,000 AGI made up of $250,000 in wages and $50,000 in capital gains, and that they have  $51,000 in itemized deductions.  Their taxable income is $249,000.  According to Forman, Goolsbee, and the Obama web site, their marginal tax rate stays at 28% and their capital gains rate stays at 15%.

What if they  only  have $49,000 in itemized deductions? Then, their taxable income is $251,000.  Uh-oh. 

Their marginal tax rate jumps from 28% to 36% (the lower of the top two brackets under the Obama Plan), and, their capital gains rate goes to 20%.  But, what exactly does that mean? Does the 20% rate get applied to all $50,000 of their capital gains, or to just $1,000 of their capital gains — the excess over the $250,000 threshold?

For  Team Obama, this is probably a just another ” technical detail” to be brushed off.  For a taxpayer, it is a 33% difference in the amount of capital gains and dividend  taxes  paid.

Also, note that there is no mention is made regarding “individuals with incomes below $200,000”.  Is that just an oversight, or should one assume that for capital gains (and dividends), individuals are families of size one? 

Regardless, it looks to me like the old marriage penalty is creeping it’s way back into the tax code via the income triggering thresholds.  For tax purposes, married couples may find themselves paying higher dividend and capital gains taxes than their income-comparable single friends.   

* * * * *

Finally, regarding the 12.4% additional payroll taxes on wages over $250,000 with the laughable provision that they’ll start in 10 years – so the next President will have to deal with it.

Currently, Social Security benefits are explicitly coupled (by formula) to employees’ taxed wages which, of course,  determine the employees fixed rate contributions to the Social Security Trust Fund.  Does Obama propose paying high-earners benefits linked to their added contributions, or does he propose redefining the Social Security program by completely de-coupling wages, contributions, and benefits ?

* * * * *

Perhaps Forman and Goolsbee will be  clarifying their clarification.

* * * * *

Want more from the Homa Files?
Click link =>
  The Homa Files Blog

* * * * *

OTP – Tax Plan or Welfare Plan ?

August 19, 2008

Excerpted from the WSJ, “Obama’s Tax Plan Is Really a Welfare Plan”, By Peter Ferrara, August 19, 2008

Barack Obama’s tax plan … proposes to raise marginal rates for just about every federal tax … the top individual income tax rates … would be increased by 13% … the top rates on capital gains and dividends would rise by a third, to 20% …  a permanent federal estate tax, with a top rate of 45% …  a new payroll tax on employers to fund his health-insurance plan … several increases in the corporate income tax, including a new so-called windfall profits tax on oil companies.

(Obama)  also proposes a raft of tax credits that taxpayers can receive if they engage in various government-specified activities.

Moreover, the tax credits would mostly go to those who pay little or nothing in federal income taxes. His trick is to make the tax credits “refundable.” Thus, if the tax credit is for $1,000, but the taxpayer would otherwise only pay $200 in taxes, the government would write a check to the taxpayer for $800. If the taxpayer pays nothing in federal income taxes, the government would pay him the whole $1,000.

In effect, Mr. Obama is proposing to create or expand a slew of government spending programs that are disguised as tax credits. The spending on these programs is then subtracted from the total tax burden, in order to make the claim that his tax plan is a net tax cut overall.

Mr. Obama proposes … having the government pay out $500 to each worker and $1,000 to couples — reminiscent of George McGovern’s 1972 election proposal for the government to send a $1,000 check to everyone … he would provide a $4,000, fully refundable tax credit for college tuition expenses …. he would provide a 10% refundablecredit -to offset mortgage interest payments … and “a new refundable 50 percent health tax credit on employee premiums paid by employers.”

Currently existing tax credits would also become spending programs in the Obama tax program. The Savers Credit would be made fully refundable, and would be expanded … The Child and Dependent Care Tax Credit would be made refundable and expanded … The Earned Income Tax Credit i–  already refundable — .would be expanded 

In short, welfare spending is to be increased by paying more money out to low-income income tax filers.

The latest Congressional Budget Office data shows the bottom 40% of income earners already pays no income taxes. Indeed, they receive a net payment from the federal income tax system — meaning from the taxpayers — equal to 3.8% of all federal income taxes, because of the refundable tax credits under current law. The middle 20% of income earners, the true middle class, pays 4.4% of federal income taxes.

Overall, the bottom 60% of income earners pay less than 1% of federal income taxes on net. When “tax credits” primarily go to this group in the form of checks from the government (rather than a reduction in their tax burden) it is simply an abuse of the language to call the spending a tax cut.

Full article (definitely worth reading):
http://online.wsj.com/article_print/SB121910303529751345.html

* * * * *

Note: Author fails to mention that a majority of voting age citizens won’t be paying any Federal income taxes under Obama

Nothing good is likely to happen when “a majority of voters discover that they can vote themselves largess out of the public treasury.” Commonly attributed to Alexander Tytler (whoever that is)

* * * * *

Self-prop: We were all over this issue a couple of weeks ago.

* * * * *

Want more from the Homa Files?
Click link =>
  The Homa Files Blog

* * * * *

Most companies in the U.S. pay no taxes … Huh ?

August 19, 2008

Excerpted from Bloomberg, “Misleading on Taxes”,  Kevin Hassett, Aug. 18, 2008

Last week, the Government Accountability Office released a report … that led to an Associated Press story with the startling headline, “Most Companies in U.S. Avoid Federal Income Taxes’

House Speaker Nancy Pelosi piled on, arguing that the data revealed a fundamental unfairness in the U.S. system, and called for reform. “When two-thirds of corporations pay no taxes… American workers are forced to pay too much in taxes even as they cope with rising prices and falling wages.”

The problem is, the study showed no such thing.

First, while it is true that 60 percent to 70 percent of companies in the study paid no tax in a given year, there was a big qualification. The study focused on an Internal Revenue Service tax database that included millions and millions of companies. The vast majority of firms in the study were tiny mom- and-pop enterprises.

Why did the tiny mom-and-pop enterprises pay no taxes? Because they didn’t make any money! The study reported that was the reason about 80 percent of the firms in the sample avoided taxes in a given year. How terrible of them.

How can it be that so many small businesses made no money? Companies tended to have no profits because they had large deductions including wages. Hot dog vendors can pay themselves a wage, in which case they have no profits but pay wage taxes, or they can take their money in profits, in which case they pay profits tax. The data suggest they tend to do the former.

Most of them do this for a simple reason: we still have double taxation of dividends. If you are a hot dog vendor in the top tax bracket and you pay yourself $100, then you pay $35 in taxes. If you keep it as profit and then pay it to yourself as a dividend, you pay a $35 corporate tax, and then a 15 percent dividend tax on top of it. Why would anyone choose the latter? To do so would be to pay more taxes voluntarily.

For big corporations, the story is different. The study found that … almost no companies went through the sample period without paying taxes. 

* * * * *

For full column:
http://bloomberg.com/apps/news?pid=20601039&sid=aJHKNW1lro9Y&refer=columnist_hassett

* * * * *

Want more from the Homa Files?
Click link =>
  The Homa Files Blog

* * * * *

Education – When schools fail our kids

August 19, 2008

 Excerpted from the Chicago Tribune,”When schools fail our kids “.
August 17, 2008

When schools fail …  their students are not the only ones who suffer. The rest of us pay the price: a less productive economy and more social ills.

Neither Obama nor McCain have done nearly enough to chart a path to better schools for all. Both have … taken refuge in vagueness.

On many points they display no real disagreement. Both endorse the federal No Child Left Behind Act; both favor spending money to help attract young people to teaching; both promise steps to make college more affordable. While each makes it clear No Child Left Behind needs changes, neither has spelled out in bold detail what he would do differently.

McCain deserves credit for being open to options that would weaken the bureaucracy of the public education industry. He wants to make it easier for people to enter teaching after spending years gaining knowledge in other fields.

McCain also favors expanding a voucher program available to low-income families in Washington, D.C.—the better to create real competition for public schools that lack enough incentive to steer kids toward better outcomes. These are the schools that lamely tolerate … the “soft bigotry of low expectations.”

The Obama campaign … says that funding vouchers … “is hardly a strategy to fix schools throughout this country.”

So where is Obama’s pathbreaking strategy? In his recent speech to the NEA, he endorsed “more accountability” and “higher standards.” No one is against those principles; the trouble is how to achieve them.

He suggests he knows the way by saying, “When our educators succeed, I will not just talk about how great they are. I will reward them for their greatness with better pay and more support.”

But how about when our educators fail? Is he willing to demand not only incentives for good teaching but penalties—reasonably prompt terminations included—for bad teaching? Would he, for example, amend No Child Left Behind to demand that school districts make it less cumbersome to get incompetents out of the classroom or the principal’s office?

He’s given no sign of it. That’s a particular shame because Obama won in the primaries without the support of either major teachers union. Given that he’s not beholden to them, he should be free to embrace remedies that previous Democratic nominees treated as untouchable.

* * * * *

For full editorial:
http://www.chicagotribune.com/news/opinion/chi-0817edit1aug17,0,6811109.story

* * * * *

Want more from the Homa Files?
Click link =>
  The Homa Files Blog

* * * * *

Quick Quiz: What’s the gambling capital of the world?

August 18, 2008

No, it’s not Vegas, and it’s certainly not Atlantic City or Biloxi …  it’s Macau.

According to the WSJ:

The combined gambling revenue for all Macau’s casinos increased 80% to HK$80.6 billion between 2005 and 2007, making it bigger than Atlantic City and the Las Vegas Strip combined.

Source:
http://online.wsj.com/article/SB121901865070348277.html?mod=hps_us_inside_today

* * * * *

* * * * *

Want more from the Homa Files?
Click link =>
  The Homa Files Blog

* * * * *

Economics – Five Ways to Wreck a Recovery

August 18, 2008

Excerpted from Washington Post, “Five Ways to Wreck a Recovery”, by Amity Shlaes, August 18, 2008

Perverse monetary policy was the greatest cause of the Great Depression. But five non-monetary missteps were important in making the Depression great, and the same missteps damaged the global economy as well. While many are thinking about the Depression, few seem concerned about replicating these Foolish Five today:

  1. Giving in to protectionism.
  2. Blaming the messenger (i.e. the stock market)
  3. Increasing taxes in a downturn.
  4. Assuming bigger government will bring back growth.
  5. Ignoring the cost of change.

The proximate danger today is a repeat of the 1970s, not the 1930s. But if lawmakers don’t remember the old missteps, they might find that their new recovery legislation imperils our recovery.

Amity Shlaes is the author of “The Forgotten Man: A New History of the Great Depression” and a senior fellow at the Council on Foreign Relations.

* * * * *

For full op-ed (worth reading):
http://www.washingtonpost.com/wp-dyn/content/article/2008/08/17/AR2008081702079_pf.html

Thanks to Dave Fedlam, MBS-MBA ’09 for the heads-up

* * * * *

Want more from the Homa Files?
Click link =>
  The Homa Files Blog

* * * * *

Under Obama’s tax plan, Buffett will pay a lower rate than his secretary …

August 18, 2008

Obama frequently rants that Warren Buffett’s tax rate is a bit under 18% — while Buffett’s $60,000 per year secretary has to pay 30%.

Among the ironies of the Obama plan –  as “clarified” by Forman and Goolsbee –  is that Buffett will still be paying a lower rate than his secretary. 

By my math, Buffett’s effective  rate will go up to about 22% (mostly due to the 5% bump in the capital gains rate) and his secretary’s rate will come down to 29% (courtesy of the $500 tax credit). 

The gap closes, but the much ballyhooed injustice is still there.

Apparently the plan’s architects fired but missed one of their most conspicuous, self-declared targets.

* * * * *

Want more from the Homa Files?
Click link =>
  The Homa Files Blog

* * * * *

Obama Tax Plan (OTP) moves in right direction …

August 18, 2008

Excerpted from IBD, “Obama Moves In Right Direction On Taxes,  Laurence Kudlow, August 15, 2008

Lo and behold, Team Obama is moving toward the supply side and pivoting toward the political center on key aspects of its tax policy.

And perhaps they are implicitly recognizing the likelihood that higher tax rates on cap-gains and dividends will generate lower revenues and a higher budget deficit.

Obama advisers  … outlined a plan that would raise tax rates on capital gains and dividends only from 15% to 20% for individuals making more than $200,000 and on family incomes above $250,000.

Before this, investors worried that Barack Obama would double the 15% tax rate on cap gains and bring the 15% rate on dividends back to 40%.

Nonetheless, the cost of capital would rise under Obama, and investment returns would decline by 11%. Uncle Sam will keep more and investors will retain less, all while the economy is languishing.

* * * * *

Another glitch in the Obama plan is the difference between the $200,000 income limit for individuals and the $250,000 threshold for two-earner families.

If two singles each earning $200,000 get married, one will have to surrender over half of what he or she earns to the government.

* * * * *

Full editorial:
http://www.ibdeditorials.com/IBDArticles.aspx?id=303692432142866

* * * * *

Want more from the Homa Files?
Click link =>
  The Homa Files Blog

* * * * *

Maybe dreams do come true …

August 15, 2008

According to New York magazine:

“In October, Obama’s former pastor, Jeremiah Wright, is expected to publish a new book and hit the road to promote it”

http://www.printthis.clickability.com/pt/cpt?action=cpt&title=The+Color-Coded+Campaign&expire=&urlID=30298633&fb=Y&url=http%3A%2F%2Fnymag.com%2Fnews%2Ffeatures%2F49138%2Findex2.html&partnerID=73272

* * * * *

Want more from the Homa Files?
Click link =>
  The Homa Files Blog

* * * * *

Uh Oh – What if employers want proof and patience ?

August 15, 2008

Excerpted from WSJ, “… College is a Waste of Time”, Aug. 13, 2008 

Re:  “evidence of competence” … and apprenticeships:

Young people entering the job market should have a known, trusted measure of their qualifications they can carry into job interviews. That measure should express what they know, not where they learned it or how long it took them. They need a certification, not a degree.

The model is the CPA exam that qualifies certified public accountants  … employers can assess where the applicant falls in the distribution of accounting competence. You may have learned accounting at an anonymous online university, but your CPA score gives you a way to show employers you’re a stronger applicant than someone from an Ivy League school.

Here’s the reality: Everyone in every occupation starts as an apprentice. Those who are good enough become journeymen. The best become master craftsmen. This is as true of business executives and history professors as of chefs and welders.

* * * * *

Full article (worth reading):
http://online.wsj.com/article/SB121858688764535107.html?mod=opinion_main_commentaries

* * * * *

Want more from the Homa Files?
Click link =>
  The Homa Files Blog

* * * * *

Taxes – Beyond Mark Twain’s observation on death and taxes …

August 15, 2008

Summary: Tell your rich relatives to check out in 2010. 

* * * * * 

Under the Bush Tax Plan, estate taxes were cleverly rebranded “death taxes” and have been phasing towards full repeal (zero federal estate taxes) in 2010. 

But after 2010, estate taxes get automatically reset to 2000-2001 levels ($675,000 exclusion, 55% rate) unless Congress extends the provisions.

click table to make it bigger

* * * * *

Some Numbers

Based on 2004 IRS data (the latest available, full table below):

2.34 million adults died (a remarkably constant number over the past decade)

19,294 taxable estate returns were filed (less than 1% of adult deaths)

$5.3 million average taxable estate

22% average tax rate on taxable estates

$22.2 billion aggregate estate taxes collected (down from $24 billion in 2000)

click table to make it bigger

Source: http://www.irs.gov/pub/irs-soi/08es01hi.xls

                                        * * * * * 

Candidates’ Plans

Obama proposes a $3.5 million exclusion ($7 million for a married couple) with a top rate at 45%.

McCain proposes raising the exclusion to $5 million per person (which is thought by many to be the appropriate size to help small-business owners avoid cash-flow difficulties upon the death of a family member). and cutting the top federal estate-tax rate to 15% (linking the death tax with the current capital-gains tax rate … so that ” Americans will not be forced to pay more in death than they would if they had sold property prior to their death)”

Both Obama & McCain support retaining the current system for valuing stocks, mutual-fund shares and other inherited property whose value has increased over the years. at the time of the death (versus the original cost basis). This “stepped-up basis”  is important to many heirs because it can affect how much they eventually owe in capital-gains tax, if anything at all, when they sell inherited property.

Source: http://online.wsj.com/article_print/SB121495543483521281.html

                                     * * * * *

Observations

1. Under either plan, very few estates — less than 1 in a hundred — would pay Federal Estate taxes. 

2. I’m surprised that the stepped-up cost basis doesn’t get more attention.  Strikes me that eliminating it makes more sense than raising capital gains rates across the board.

3. These are only FEDERAL estate taxes.  States impose their own estate taxes  — and they vary widely (e.g. NY and NJ are high; FL and NV are low). For state rates check out  http://www.finance.cch.com/text/c50s15d170.asp

4. Charities will benefit (versus complete repeal).  The super-rich can direct mega-gifts to charities and foundations to at least keep the money out of the government’s hands.

5.  Heirs may benefit by getting an early distribution of estates via gifts … which are limited to $12,000 per giftor / giftee combo … meaning that a married couple can give $24,000 to an individual, tax free, each year

6. Bottom line, for all but the uber-rich, this doesn’t seem like a big issue — as long as the candidates follow through on their promises (ok, call me cynical).

7. I say, since Warren Buffet is parading his tax guilt so publicly these days, set up a separate provision to tax all of his estate 100%.  (Note: Buffet announced plans to give much of his estate  to the Gates Foundation.  That’s a worthy cause, but diverts money from the government coffers — where he wants everybody else’s money to go. Gotta ask: huh?)  


* * * * * 

Want more from the Homa Files?
 
Click link =>  The Homa Files Blog

In the Wall Street Journal …

August 14, 2008

The  WSJ.com “Forum” accepted an abbreviated  Homa Files post.

Subject is the Obama tax plan, of course.

To see the post “live”, click the link and scroll down until you get to “homak” in the left hand column

http://forums.wsj.com/viewtopic.php?t=3687&autoredirect=true&sid=233db09d1fae8f63f5719726f4dfe89b

click image to make it bigger

* * * * *

The Obama Tax Plan 
homak’s reply

In their op-ed outline of Obama’s tax plan, Furman & Goolsbee make a valiant effort to focus attention on the capillaries instead of the jugular.

The most fundamental issue, if the Obama plan is enacted, is that a minority of voting age citizens will be paying 100% of all Federal income taxes. A majority will not be paying any Federal income taxes at all.

Currently, according to IRS data, 41% don’t pay any income taxes. Obama’s web site claims that 10 million more will be taken off the tax rolls via his $500 and $1,000 tax credits; another 7 million are seniors currently paying some income taxes who come off the rolls. Those 17 million additions push the number to 49%.

And, the Obama campaign projections are probably low — very low.

Based on the 2006 IRS data, approximately 22 million adults were represented on tax returns for married couples filing jointly that reported AGI less than $27,500 and paid some income taxes. Doing the tax credit math, they come off the tax rolls and push the percentage up to 51%.

Further, there are about 4.7 million childless individuals who earn less than $13,750 and currently pay some income taxes. They come off the rolls and push the number to 55% — a comfortable majority.

(For a complete analysis, see https://kenhoma.wordpress.com/2008/07/31/under-obama-tax-payers-will-be-a-minority/)

* * * * *

Based on the hard numbers, Obama’s plan will create a new majority — a powerful voting block of non-tax payers.

For those in the emerging majority that won’t pay any Federal income taxes – or may even be getting government checks for tax credits due – the deal is almost too good to be true. To them, Obama’s plan must make perfect sense. Obama can probably count on their vigorous and perpetual support.

But those in the new tax paying minority, there’s cause for concern. What if the new majority decides that more government services are needed, or that a mere $100 billion, or so, of income redistribution isn’t enough to balance the scales? There will be no way to stop the train.

The Tax Foundation — a nonpartisan tax research group – has repeatedly warned that “While some may applaud the fact that millions of low- and middle-income families pay no income taxes, there is a threat to the fabric of our democracy when so many Americans are not only disconnected from the costs of government but are net consumers of government benefits. The conditions are ripe for social conflict if these voters begin to demand more government benefits because they know others will bear the costs.”

(See http://www.taxfoundation.org/research/show/1111.html)

Want more from the Homa Files?
Click link =>
  The Homa Files Blog

* * * * *

Olympics – There’s no such thing as too much beach volleyball …

August 14, 2008

Excerpted from WSJ, “Beach Volleyball’s Moment”, August 14, 2008

The sport, with its beach-party atmosphere featuring impeccably cut and tanned athletes competing in skimpy bathing suits, is seen as having huge entertainment potential, which is why NBC is featuring it live in prime time throughout the Summer Games.

A number of promoters … hope the attention will help them turn beach volleyball into a perennial moneymaker, rather than a novelty hit that comes along every four years.

Despite the millions tuning into the myriad attractions of beach volleyball during the Games, the Association of Volleyball Professionals Inc., which operates games around the U.S. under the banner of the AVP Crocs Tour, is struggling to become profitable.

NBA Commissioner David Stern sees promise in professional volleyball. “You’ve got a good game, a young demographic, a great setting,” he says. “It’s got a lot going for it.”

AVP’s organizers saw opportunity in a game that traces its roots to a popular sun-splashed lifestyle. Moving from city to city, the AVP Crocs Tour is a roving, three-day beach party, with music, food and fun centered around a traveling 5,000-seat stadium.

AVP’s best players now earn several hundred thousand dollars each year in prize money and endorsements, such as swimsuit endorsements …  But many AVP players don’t make enough to cover their expenses …. some players occasionally sleep on the beach at tour events.

“I never planned to earn any money at this,”  said one competitor. “I thought I was going to have to get a real job.”

For full article (with pictures):
http://online.wsj.com/article_print/SB121867765133039329.html

* * * * *

Why not? A beach volleyball channel ?

Oh, I guess NBC has that locked up already …

* * * * *

Want more from the Homa Files?
Click link =>
  The Homa Files Blog

* * * * *

Taxes – Campaign’s economic advisers clarify Obama’s tax plan …

August 14, 2008

Excerpted from the WSJ, “The Obama Tax Plan”, By JASON FURMAN and AUSTAN GOOLSBE, economic policy director and senior economic adviser to Obama; August 14, 2008

Barack Obama proposes fiscally responsible tax reform to strengthen our economy and restore the balance that has been lost in recent years …

Sen. Obama’s tax plan … has even lower taxes than prevailed in the 1990s — including lower taxes on middle-class families, lower taxes for capital gains, and lower taxes for dividends.

Overall, Sen. Obama’s middle-class tax cuts are larger than his partial rollbacks for families earning over $250,000 …  reducing revenues to less than 18.2% of GDP — the level of taxes that prevailed under President Reagan.

Sen. Obama is focused on cutting taxes for middle-class families and small businesses, and investing in key areas like health, innovation and education.

Sen. Obama … would cut taxes for 95% of workers and their families with a tax cut of $500 for workers or $1,000 for working couples.

In addition, Sen. Obama is proposing tax cuts for low- and middle-income seniors, homeowners, the uninsured, and families sending a child to college or looking to save and accumulate wealth.

Sen. Obama also … is proposing additional tax cuts, including a tax credit for small businesses that provide health care, and the elimination of capital gains taxes for small businesses and start-ups.

Sen. Obama … would repeal a portion of the tax cuts passed in the last eight years for families making over $250,000.

The top two income-tax brackets would return to their 1990s levels of 36% and 39.6%

The top capital-gains rate for families making more than $250,000 would return to 20%

The tax rate on dividends would also be 20% for families making more than $250,000.

The estate tax would be effectively repealed for 99.7% of estates, and retained at a 45% rate for estates valued at over $7 million per couple.

Overall, in an Obama administration, the top 1% of households — people with an average income of $1.6 million per year — would see their average federal income and payroll tax rate increase from 21% today to 24%.

Sen. Obama … would not raise any taxes on couples making less than $250,000 a year, nor on any single person with income under $200,000 — not income taxes, capital gains taxes, dividend or payroll taxes.

As previously mentioned, the Obama plan is a net tax cut — his middle-class tax cuts are larger than the rollbacks he has proposed for families making over $250,000.

While Sen. Obama would … strengthen solvency by asking those making over $250,000 to contribute a bit more to Social Security to keep it sound.

Sen. Obama  … is considering plans that would ask those making over $250,000 to pay in the range of 2% to 4% more … starting a decade or more from now .

Do not take the critics’ word for it. Go look at the plans for yourself at www.barackobama.com/taxes

Full article:
http://online.wsj.com/article_print/SB121867201724238901.html

Also read: Washington Post, “Obama Tax Plan Would Balloon Deficit”
http://www.washingtonpost.com/wp-dyn/content/article/2008/08/09/AR2008080901860.html

* * * * *

Ken’s Observations

1. Be sure to note the comparison bases for all of the changes … Reagan’s proposals — which were coming off the Carter years, and the Bush changes — which came after Clinton jacked up rates. 

The core question to ask: was the prosperity during the Clinton years due to the realization of changes  from the Reagan tax cuts or from near instantaneous stimulus  induced by Clinton tax hikes?  Hmmm.

2.  My personal prediction: stock market goes down 15 to 25% if the tax rates on dividends and capital gains get implemented.  Biggest impact will be on baby boomers who thought they’d be retiring from work.  No way most of them will be able to afford it.

3. The Social Security proposal isn’t just a rate change, it’s a fundamental philosophical change — decoupling contributions to the trust fund (i.e. payroll taxes) from the benefits eventually received. Social Security becomes just another income redistribution program.  (See details in today’s other post). 

4. The editorial recap fails to mention that Obama’s proposals will result in a minority of voting age citizens paying any  income taxes.  For those of you in the emerging minority of tax payers, watch out.  If the new non- taxpaying majority wants more programs or more wealth distribution, there won’t be anything you can do to stop the train.

5. Dogbert lives …


* * * * * 

Want more from the Homa Files?
Click link =>
  The Homa Files Blog

* * * * *

Full Text from WSJ:

The Obama Tax Plan
By JASON FURMAN and AUSTAN GOOLSBEE
August 14, 2008;

Even as Barack Obama proposes fiscally responsible tax reform to strengthen our economy and restore the balance that has been lost in recent years, we hear the familiar protests and distortions from the guardians of the broken status quo.

Many of these very same critics made many of these same overheated predictions in previous elections. They said President Clinton’s 1993 deficit-reduction plan would wreck the economy. Eight years and 23 million new jobs later, the economy proved them wrong. Now they are making the same claims about Sen. Obama’s tax plan, which has even lower taxes than prevailed in the 1990s — including lower taxes on middle-class families, lower taxes for capital gains, and lower taxes for dividends.

Overall, Sen. Obama’s middle-class tax cuts are larger than his partial rollbacks for families earning over $250,000, making the proposal as a whole a net tax cut and reducing revenues to less than 18.2% of GDP — the level of taxes that prevailed under President Reagan.

Both candidates for president have proposed tax plans. But they are starkly different in their approaches and their economic impact. Sen. Obama is focused on cutting taxes for middle-class families and small businesses, and investing in key areas like health, innovation and education. He would do this while cutting unnecessary spending, paying for his proposals and bringing down the budget deficit.

In contrast, John McCain offers what would essentially be a third Bush term, with his economic speeches outlining $3.4 trillion of tax cuts over 10 years beyond what President Bush has already proposed and geared even more to high-income earners. The McCain plan would lead to deficits the likes of which we have never seen in this country. It would take money from the middle class and from future generations so that the wealthy can live better today.

Sen. Obama believes a focus on the middle class is appropriate in the wake of the first economic expansion on record where the typical family’s income fell by almost $1,000. The Obama plan would cut taxes for 95% of workers and their families with a tax cut of $500 for workers or $1,000 for working couples. In addition, Sen. Obama is proposing tax cuts for low- and middle-income seniors, homeowners, the uninsured, and families sending a child to college or looking to save and accumulate wealth.

The Obama plan would dramatically simplify taxes by consolidating existing tax credits, eliminating the need for millions of senior citizens to file tax forms, and enabling as many as 40 million middle-class filers to do their own taxes in less than five minutes and not have to hire an accountant.

Sen. Obama also recognizes that small businesses are the engine of job growth in the economy. That is why he is proposing additional tax cuts, including a tax credit for small businesses that provide health care, and the elimination of capital gains taxes for small businesses and start-ups. The vast majority of small businesses would face lower taxes under the Obama plan than under the McCain plan. In addition, Sen. Obama supports reforming corporate taxes in a manner that would help create jobs in America and simplify the tax code by eliminating distortions and special preferences.

Sen. Obama believes that responsible candidates must put forward specific ideas of how they would pay for their proposals. That is why he would repeal a portion of the tax cuts passed in the last eight years for families making over $250,000. But to be clear: He would leave their tax rates at or below where they were in the 1990s.

– The top two income-tax brackets would return to their 1990s levels of 36% and 39.6% (including the exemption and deduction phase-outs). All other brackets would remain as they are today.

– The top capital-gains rate for families making more than $250,000 would return to 20% — the lowest rate that existed in the 1990s and the rate President Bush proposed in his 2001 tax cut. A 20% rate is almost a third lower than the rate President Reagan set in 1986.

– The tax rate on dividends would also be 20% for families making more than $250,000, rather than returning to the ordinary income rate. This rate would be 39% lower than the rate President Bush proposed in his 2001 tax cut and would be lower than all but five of the last 92 years we have been taxing dividends.

– The estate tax would be effectively repealed for 99.7% of estates, and retained at a 45% rate for estates valued at over $7 million per couple. This would cut the number of estates covered by the tax by 84% relative to 2000.

Overall, in an Obama administration, the top 1% of households — people with an average income of $1.6 million per year — would see their average federal income and payroll tax rate increase from 21% today to 24%, less than the 25% these households would have paid under the tax laws of the late 1990s.

Sen. Obama believes that one of the principal problems facing the economy today is the lack of discretionary income for middle-class wage earners. That’s why his plan would not raise any taxes on couples making less than $250,000 a year, nor on any single person with income under $200,000 — not income taxes, capital gains taxes, dividend or payroll taxes.

In contrast, Sen. McCain’s tax plan largely leaves the middle class behind. His one and only middle-class tax cut — a slow phase-in of a bigger dependent exemption — would provide no benefit whatsoever to 101 million families who do not have children or other dependents, or who have a low income.

But Sen. McCain’s plan does include one new proposal that would result in higher taxes on the middle class. As even Sen. McCain’s advisers have acknowledged, his health-care plan would impose a $3.6 trillion tax increase over 10 years on workers. Sen. McCain’s plan will count the health care you get from your employer as if it were taxable cash income. Even after accounting for Sen. McCain’s proposed health-care tax credits, this plan would eventually leave tens of millions of middle-class families paying higher taxes. In addition, as the Congressional Budget Office has shown, this kind of plan would push people into higher tax brackets and increase the taxes people pay as their compensation rises, raising marginal tax rates by even more than if we let the entire Bush tax-cut plan expire tomorrow.

The McCain plan represents Bush economics on steroids. It has $3.4 trillion more in tax cuts than President Bush is proposing, largely directed at corporations and the most affluent. Sen. McCain would implement these cuts without proposing any meaningful steps to simplify taxes or eliminate distortions and loopholes. In addition, Sen. McCain has floated over $1 trillion in new spending increases but barely any specific spending cuts.

As previously mentioned, the Obama plan is a net tax cut — his middle-class tax cuts are larger than the rollbacks he has proposed for families making over $250,000. Sen. Obama would pay for this tax cut by cutting spending — including responsibly ending the war in Iraq, reducing excessive payments to private plans in Medicare, limiting payments for high-income farmers, reducing subsidies for banks that make student loans, reforming earmarks, ending no-bid contracts, and eliminating other wasteful and unnecessary programs.

While Sen. Obama would shrink the deficit from its current record levels, he recognizes that it is even more important to confront our long-term fiscal challenges, including the growth of health costs in the public and private sector. He also believes it is critical to work with members of Congress from both parties to strengthen Social Security while protecting middle-class families from tax increases or benefit cuts. He has done what few presidential candidates have been willing to do by making a politically risky proposal to strengthen solvency by asking those making over $250,000 to contribute a bit more to Social Security to keep it sound.

Sen. Obama does not support uncapping the full payroll tax of 12.4% rate. Instead, he is considering plans that would ask those making over $250,000 to pay in the range of 2% to 4% more in total (combined employer and employee). This change to Social Security would start a decade or more from now and is similar to the rate increases floated by Sen. McCain’s close adviser Lindsey Graham, and that Sen. McCain has previously said he “could” support.

In contrast, Sen. McCain has put forward the most fiscally reckless presidential platform in modern memory. The likely results of his Bush-plus policies are clear. As Berkeley economist Brad Delong has estimated, the McCain plan, as compared to the Obama plan, would lower annual incomes by $300 billion or more in real terms by 2017, costing the typical worker $1,800 or more due to the effect of large deficits on national savings and thus capital formation. Sen. McCain’s neglect of critical public investments would further impede economic growth for decades to come.

Do not take the critics’ word for it. Go look at the plans for yourself at www.barackobama.com/taxes1. Get the facts and you will see the real priorities at stake in this election. America cannot afford another eight years like these.

Messrs. Furman and Goolsbee are, respectively, economic policy director and senior economic adviser at Obama for America.

* * * * *

Taxes – Payroll taxes, especially Social Security, are regressive … NOT !!!

August 14, 2008

Summary: In prior posts, I set-up the following issue …

Some policy analysts (typically left-leaning) such as  Robert Reich, Bill Clinton’s former Secretary of Labor argue that “Most Americans pay more in payroll taxes than in income taxes … payroll taxes take a much bigger portion of the paychecks of lower-income Americans than of higher-income … Viewed as a whole, the current tax system is quite regressive.”
http://economistsview.typepad.com/economistsview/2007/10/robert-reichs-p.html

Other analysts such as the Urban Institute clarify  “The payroll tax is very regressive with respect to current income: The average tax rate falls as income rises …  (But) the regressivity of the payroll tax is mitigated to a substantial extent when Social Security and Medicare benefits are considered as well.
http://www.urban.org/publications/1001065.html

But analysts generally “punt” the question “what is the effect when both payroll taxes and their benefits are considered ? ”  Why ? In part, I suspect, because they know the  answer doesn’t fit their politics … and, in part, because the analysis is challenging — with many nuances and moving parts.

In this post, I take a shot at the “combined effect” question by applying some fundamental financial analysis tools. 

Specifically, I treat Social Security benefits as an annuity stream to individual retiring workers and I treat annual  payroll taxes over a worker’s career as periodic “premiums” that get applied to the “purchase” of the annuity.”contract”.  After adjusting for inflation, the difference between the present value of the expected benefits stream and the present value of the “premiums” paid over the years is, in essence, the real tax that a plan participant pays.

The answer: low wage earners pay practically nothing for their benefits — their contributions are simply a forced saving for their retirement benefits.  High earners get relatively little of their contributions back —  in effect, paying a tax rate over 60%

* * * * *

Analytical Details

Regarding Social Security, a Congressional Joint Economic Committee reports:

“The rapid growth in payroll taxes over the past 40 years has imposed a large burden on working Americans. This burden has fallen disproportionately on low-income workers.

However, in the context of a comprehensive tax policy, it is misleading to focus on the short-term burden imposed by payroll taxes without accounting for the future benefits they provide through the Social Security program.

Social Security benefits are paid according to a progressive formula that gives low-wage workers a better rate of return on their contributions than it gives high-wage workers. The progressivity of the benefit formula outweighs the disproportionate burden imposed by the tax.

As a result, low-wage workers can expect to receive benefits that exceed the sum of their and their employers’ payroll tax contributions. Middle- and high-wage workers, on the other hand, can expect to pay substantially more into the system than they will receive in benefits.

Overall, middle- and high-wage workers subsidize the income and payroll tax liabilities of low-wage workers, leaving most low-wage workers with net negative tax liabilities throughout their lifetimes.”
http://www.house.gov/jec/fiscal/tx-grwth/payroll/payroll.htm

* * * * *

Here’s what the Joint Economic Committee is talking about:

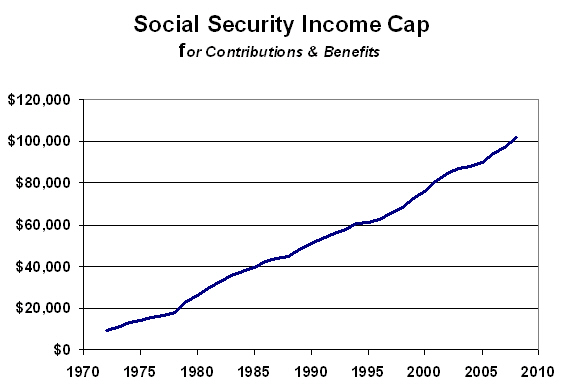
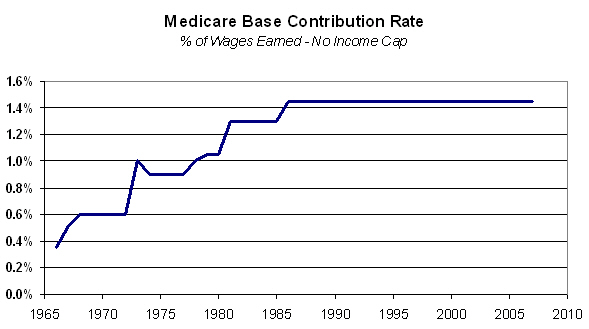
The amount employees have deducted from their paychecks is determined by the Social Security tax rate and annual income “caps” – the maximum amount of wages subject to the tax.  The Social Security tax rate has been flat for almost 20 years; and the income cap has consistently increased over the years.


Currently. an employee’s Social Security tax rate is 6.2% on annual wages up to $102,000.  For high earners, the rate drops to zero for any wages over $102,000 in a given year.


For example, somebody earning $50,000 has $3,100 deducted from their paychecks [6.2% times $50,000].  Somebody earning $102,000 has $6,324 deducted [the same 6.2% times $102,000].  Somebody earning $200,000 has $6,324 deducted [6.2% times the $102,000 income “cap”; 0% on wages over $102,000] — so their effective rate drops to 3.2%.  The more somebody earns over the $102,000 income cap, the lower their effective rate.. By definition, that’s a regressive tax, right?


* * * * *


Not so fast.  There’s more to the story.


First, the 6.2% tax rate is literally only half of the story.  Employer’s are legally obligated to pay a matching amount to the Social Security fund (similar to a company matching 401-K contributions — but certainly not voluntary).  So, the applicable rate is really 12.4% (2 times 6.2%) — up to $102,000 in earnings. 

  • Note: Most economists argue that, in the final analysis, employees bears the full burden of the employer’s matching amounts since employers probably cover the tax by reducing wages – or viewed conversely, employers would raise wages if they weren’t stuck paying the Social Security taxes.  That conclusion is debatable, but we’ll accept it and treat the full.12.4% as a charge incurred by the employee).  
  • Note: Employers can deduct their share of the contribution for income tax purposes, but workers’ shares are not tax deductible.  For simplicity, we’ll ignore that taxing distinction. 

Obviously, doubling the rate ups the ante, but it doesn’t make this payroll tax any more (or less) regressive or progressive.


Second, while Social Security payroll deductions fit the technical definition of a tax    i.e.  a “levy” imposed on an individual or a legal entity by a government — they don’t act like most taxes. 


Most taxes are collected to fund a common interest (say, defending the country or building a bridge).  The amount that a taxpayer gets charged, is de-coupled from the benefits they (the tax payers) may receive. That is, the taxpayer may or may not actually receive a direct (or indirect) benefit, and any benefits that they do receive are almost always non-monetary (e.g. riding on a freshly paved highway, calling for an EMT crew)..


Social Security is different – it is both monetary and coupled. With Social Security, the benefits are strictly monetary – monthly retirement income checks – and are based on a  formula that is explicitly coupled to the beneficiary’s career income and corresponding contributions to the Social Security fund.


* * * * *


Let’s illustrate Social Security math using a hypothetical retiree.  We’ll call him Harry the High-earner — for shorthand referencing, just plain old Harry. 


Assume that Harry – an unmarried guy — turns 66 on January 1, 2008 and decides to retire — claiming his full Social Security benefits.

  • Note: if Harry had retired at an earlier age, say 62, he would have started receiving scaled down benefits a few years earlier. 

Also assume that Harry has been working since age 25, that he earned precisely the maximum taxable base earnings each year (i.e. the year-by-year equivalent of 2008’s $102,000 wage cap), and that he and his employer both paid the applicable Social Security rates each year on those earnings. 


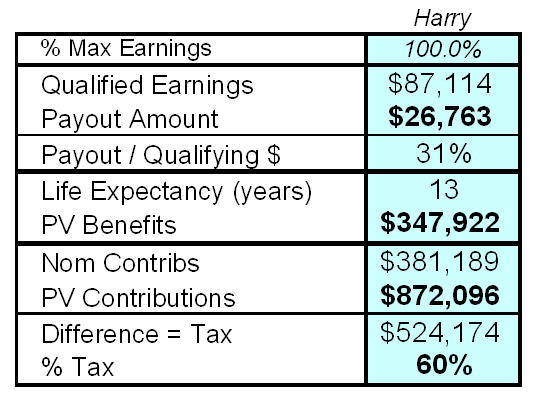
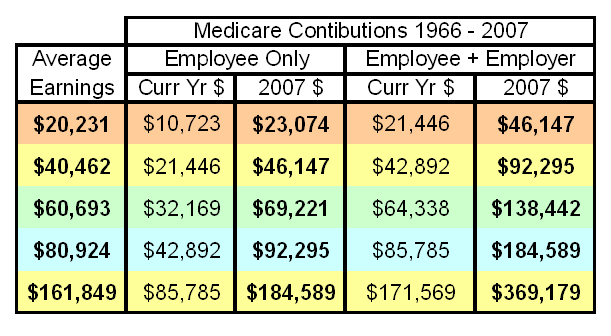
Applying historical Social Security rates and income caps, during the 41 year period (since age 25), Harry would have had $190,595 deducted from his paychecks.  His employer would have matched that amount  dollar-for-dollar.   


Again, economists usually argue that employee’s bear the burden of their employer’s contributions since they are  simply a diversion of higher  wages that might have been paid to the employee.  So, Harry’s total contributions – including his employers’ portions — are $381,189. 


The $381,189 is a “nominal” amount since it doesn’t reflect the impact of inflation over the years.  Using government-provided inflation indexing factors, the $381,189 has a “real” worth — in 2008 dollars – equal to $872,096.  That’s how much Harry and his employer paid into the Social Security fund, adjusted for inflation.

http://www.ssa.gov/pubs/10070.html#a


Conceptually, when he retires and starts drawing benefits, Harry is taking the $872,096 in accumulated contributions (stated in 2008 dollars) and investing the whole amount in an annuity —  a steam of checks that he’ll be receiving from the government.


How much is the annuity worth to Harry?  That is, what’s Harry getting for his $872,096 ?


The annuity valuation has two main components: the amount of the periodic payments and the duration of the payment stream.


Social Security benefits are based  on a relatively complex formula that factors historical earnings against a sharply dropping scale of payouts. 


Specifically, the Social Security  formula “looks back” over an employee’s career, picking the 35 years in which the employee earned the highest taxable wages (up to each year’s income cap).   The employee’s top 35 years of taxed earnings are then indexed to reflect inflation – i.e. “inflated” to current day dollars — and then averaged. .


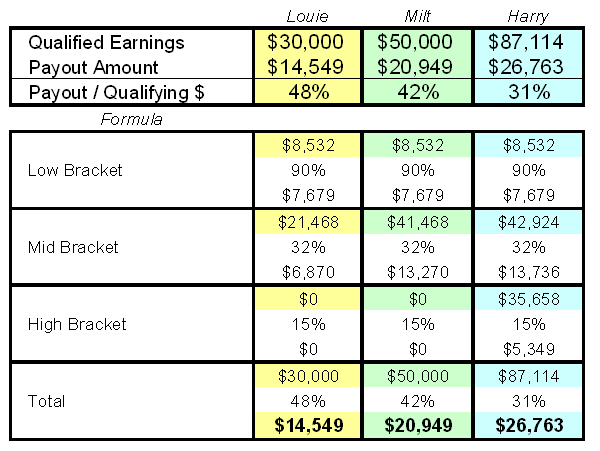
Then, the qualified earnings (i.e. the 35 year average) are plugged into the sliding scale formula to determine the initial annual amount to be received in Social Security benefits.  90% of the first $8,532 counts; 32% of the next $42,924 (up to $51,456) counts; and only 15% of any excess over $51,456 counts.


Since we’re assuming that Harry earned the maximum taxable income in each year, his top 35 years are the last 35 years (since the income cap has been consistently going up).  His inflation adjusted average income over that period is $87,114.


Plugging the $87,114 into the Social Security benefits formula, Harry’s initial annual Social Security benefit will be $26,763 — 31% of his inflation adjusted average annual wages for his highest 35 years’ earnings.


How long will Harry  be getting the payments?


That’s conceptually easy to answer: Until he dies.  

  • Note: If Harry had been married, payments would come until both Harry and his wife die  — since she would have survivor rights to his benefits).  

Currently, the average life expectancy in the U.S. is 78 years.  For simplicity assume that Harry is actuarially average, so he will get the $26,763 in annual benefits for 13 years — until age 78.  


Harry’s total  “annuity benefits” are $347,922 — 13 years times $26,763.  Assuming that the $26,763 gets inflation adjusted in future years (i.e. the Social Security Administration boosts the benefit each year to relect inflation), then the  $347,922 is — by definition — expressed in real 2008 dollars.

Pulling the parts together: stated in 2008 dollars,  Harry (and his employer) paid $872,096 to get annuity benefits worth $347,922. 

The $524,174 difference is the real Social Security tax that Harry paid — a whopping 60%


For comparison, let’s apply the same analytical logic and run the numbers for two other retirees who have  exactly the same profiles as Harry (the high-earner), except that they earned less during their best 35 years.


Low-earning Louie earned an inflation adjusted average of $30,000 and mid-earning Milt earned an inflation adjusted average of $50,000.   So, their respective calculated initial annual benefits are $14,549 (which works out to be 48% of $30,000) and $20,949 (42% of $50,000). High-earning Harry only got 31% of his inflation adjusted average wages in annual benefits.


For analytical simplicity, let’s assume that Louie and Milt earned a constant percentage of the Social Security income cap each year.  Applying that assumption, their $30,000 and $50,000 wage bases translate to 34% and 57% of each year’s income cap.  (Trust me and Excel Solver on the percentages).


Let’s assume that  Louie and Milt – like Harry — have been working and contributing to Social Security since age 25.  Then, we can multiply Louie and Milt’s income  cap percentages (34%, and 57%) times each year’s income cap (keeping in mind that it has increased in most years) — multiply that number (annual taxable wages) times the Social Security tax rate in each year (the total of the employees’ and employers’ contributions) – and then sum across the years (from age 25 to age 65).


The answer: Louie and Milt kicked in a total of $131,272 and $218,276, respectively.  Again, those are “nominal” totals, unadjusted for inflations. 


Applying the Social Security Administration’s inflation  factors –  the same ones used for the benefits calculation —   the nominal totals “inflate”  to $300,328 and $500,547 in 2008 dollars.


The rest of the analysis  is simply arithmetic: Louie kicked in $300,328 to secure an annuity with a present value (at retirement) of  $189,131.  The difference ($111,197) is, in essence, the implicit  net Social Security tax that Louie paid —  37% of his inflation adjusted contributions. 


Milt put in $500,547 to get $272,331 in benefits – an implicit tax of $228,215 – 46% of Milt’s inflation adjusted contributions. And trust me, below Louie’s qualifying income level, the rate drops further —  very quickly.


* * * * *


The Bottom Line:


Social Security “payroll taxes” are fundamentally different from other types of taxes because they represent a future payment back to the contributor. 


Thus. payroll taxes cannot be viewed in isolation, but must instead be viewed in the lifetime context of tax payments and retirement benefits. http://www.house.gov/jec/fiscal/tx-grwth/payroll/payroll.htm


When both the taxes on current wages and the eventual benefits realized are both considered, real tax rates increase with income and Social Security is then – by definition – a  very progressive plan. 


Case closed !


* * * * *

Want more from the Homa Files?
Click link =>
  The Homa Files Blog

* * * * *


Bummer – Where’s a guy supposed to eat ?

August 13, 2008

Excerpted from the WSJ, “Uno Restaurant Chain …Facing Pinch”, Aug. 13, 2008

Uno Chicago Grill, a chain of 200-plus pizzeria-themed restaurants, will skip a bond payment on Friday as it tries to negotiate more financial breathing room.

Uno grew from a single Chicago landmark and is one of a growing number of regional and national restaurant companies squeezed by falling sales, rising food costs and burdensome debt.

Uno sales held up until late 2007, but have slid the last three quarters. Same-store sales were down 7.7 percent in the first quarter of 2008.

Long known for deep-dish, Chicago-style pizzas, Uno moved in recent years to a more expansive menu of grilled, fried and sautéed fare, including Angus beef steaks and Bolognese pasta, and drinks such as pomegranate margaritas.

Other chains, such as Chevys Fresh Mex are also in talks with their lenders

During the first half of 2008, same-store sales at midpriced sit-down restaurants declined an average of 1.1%.

In the last few months, sit-down chains such as Bennigan’s, Steak and Ale, Bakers Square and Village Inn chains have filed for liquidation or bankruptcy protection.

“Those other restaurants that filed, their concepts haven’t remained relevant. Ours has,” said Uno’s CFO.

Full article:
http://online.wsj.com/article/SB121859719364035879.html?mod=hpp_us_whats_news

* * * * *

Observations

1. First, the IHOP down the street closes … now this.

2.  “Our concept has remained relevant” … so why are you diffusing your image by promoting Bolognese pasta and pomegranate margaritas … stick to deep-dish, man.

* * * *  

Want more from the Homa Files?
Click link =>
  The Homa Files Blog

* * * * *

See, demand curves really do slope downward

August 13, 2008

Excerpted from Reuters, “Biggest drop in U.S. oil demand in 26 years”, Aug. 10 2008 

The Energy Information Administration said that U.S. oil demand during the first half of 2008 fell by an average 800,000 barrels per day (bpd) compared with the same period a year ago, the biggest volume decline in 26 years. (Note: that’s a drop of just under 4%)

Global oil consumption rose by 500,000 bpd in the six-month period, the EIA said. (Note: In other words, the ROW consumed 1.3 million more bpd)

The Energy Department’s analytical arm sees continued falling oil demand, and for the first time is predicting that U.S. petroleum consumption in 2009 will be lower than this year, which would mark a drop in annual demand for three years straight.

High gasoline prices have cut into U.S. demand, but the EIA expects lower pump costs through December than previously forecast, with gasoline averaging $3.81 a gallon in the fourth quarter compared with the record $4.11 reached in July.

Full article:
http://news.yahoo.com/s/nm/20080812/us_nm/usa_oil_demand_dc_2

* * * * *

So, when price goes up, demand goes down,  How about that …

* * * * *

Want more from the Homa Files?
 
Click link =>  The Homa Files Blog

* * * * *

Taxes – For sure, Medicare is a progressive plan !

August 13, 2008

Some politicos and pundits say that payroll taxes — the paycheck deductions that fund Medicare and Social Security are regressive taxes — with high earners paying lower rates than low earners. 

For Medicare, they point out that that the same tax rate is applied to both high and low wages — the definition of a regressive tax. 

First, no it isn’t.  It’s a neutral of proportional tax.  A regressive tax rate goes down as income increases.  This one stays the same.

More important, though, the benefits eventually received are identical — whether a taxpayer contributed a little or a lot. 

When the Medicare program is considered in its totality — contributions and benefits — it’s clearly progressive — with high earners paying way more for the same benefits that low earners get.

* * * * *

The Details

The Medicare Program was introduced in 1966.  It is  primarily “our country’s health insurance program for people age 65 or older” — “helping” to pay (i.e. not paying all) for hospital services & stays, doctors, medical supplies, and prescription drugs.  The latter is courtesy of the Bush administration.

Generally, people who qualify for Social Security benefits qualify for Medicare.  Importantly, everyone who’s on Medicare gets exactly the same benefits package — regardless of how much they paid into the program over the years through payroll deductions.

Medicare isn’t a free program. 

First, plan participants (i.e. retirees)  have to pay monthly premiums.  Most folks pay about $100 per month ($1,200 annually), but higher income participants pay more, scaled to their retirement incomes.  Folks with super-sized retirement benefits pay $2,860 per year — 2.4 times the low-earners premium.  That’s progressive, not regressive — but since about 95% of plan participants pay the minimum monthly benefit, it’s not a big deal.


click table to make it bigger

click table to make it bigger


What are a big deal are the contibutions that people pay during their working years.

The bulk of Medicare funding (roughly 75%) comes from paycheck deductions over a wage earners career.  While these are deductions are popularly referred to as “payroll taxes”, they are called “contributions” on the Social Security web site — indicating that they are more akin to prepaid insurance premiums that general taxes.

The contribution rates have increased over the years (see chart below).  These days, employees have 1.45% of their wages deducted from their paychecks — with  no income limits.  So, a person earning $25,000 pays $362.50 to the government dor safe-keeping; a person earning $150,000 pays $2,175.  Though the amounts are way different, the rate is the same — 1.45%.  Some people consider the constant rate to be regressive.  In fact, : it’s neither regressive nor progressive — it’s proportional and, thus, income neutral. 


Employers are obligated to match employees’ Medicare contributions dollar-for-dollar.  So, the combined Medicare contribution is 2.9% — half paid by employees and half paid by employers.  Since self-employed folks are both employers and employees, that get docked for the full 2.9%

  • Note: Most economists say that the employer contribution is an employee burden.  They argue that if employers didn’t have to make the matching contribution, then employee wages would be higher by that amount. 

The big deal is that the cumulative “insurance premiums” paid by a high earner are SUBSTANTIALLY higher than low-earners’ contributions.

For example, take 5 individuals who have been earning wages since 1966 (the uear Medicare was introduced).  A relatively low-earner — with average earnings of about $20,000 over the period 1966 to 2007 — would have paid about $10,700  in Medicare premiums during that period.  Inflation indexing each year’s “current year” dollars (i.e. the “nominal amounts”), the premium are worth over $23,000 in 2007 dollars (i.e. “real amounts”).  A relatively high-earner — raking in average wages of about $80,000  — would have contibuted about $43,000 in current year dollars — inflated up to about $92,000 in 2007 dollars.  Middle-earners pay between those low and high amounts; uber-earners pay, and pay, and pay.


click table to make it bigger

click table to make it bigger

  • Note: The employer contributions don’t impact the degree to which the Medicare program is regressive or progressive — but, when conbined with the employee contributions and inflated up to 2007 dollars, might raise some questions about the program’s fundamental economics.

Again, keep in mind that Medicare benefits are identical for all — regardless of how much was paid into the program over the course of a wage earner’s career. 

So, high-earners pay substantially more than low-earners for exactly the same benefits.  And, high-earners who get high pension benefits or IRA payouts — a very likely correlation —  get even less in program benefits since their premiums are higher (than low-earning retirees).

* * * * *

The bottom line:

Curent year Medicare paycheck deductions are income neutral since the same rate applies to all wage earners, with no cap on the income level.

The premiums paid by high-earners are literally multiplles of the premiums paid by low-earners.

Benefits are identical, regardless of whether a person is a high- or low- wage earner.  Arguably, the benefits are slightly progressive since high retirement earners have to pay higher Medicare premiums.

There’s no way that anybody can say with a straight face that the Medicare portion of “payroll taxes” is regressive?  It’s progressive — in fact, very progressive.  PERIOD ! 

 * * * * * 

Next up: So, what about Social Security — regressive or progressive ?

* * * * *

More re: Medicare from the goverbment web site:
http://www.ssa.gov/pubs/10043.html#part2

Medicare is our country’s health insurance program for people age 65 or older. Certain people younger than age 65 can qualify for Medicare, too, including those who have disabilities and those who have permanent kidney failure or amyotrophic lateral sclerosis (Lou Gehrig’s disease). The program helps with the cost of health care, but it does not cover all medical expenses or the cost of most long-term care.

Medicare has four parts

  • Hospital insurance (Part A) that helps pay for inpatient care in a hospital or skilled nursing facility (following a hospital stay), some home health care and hospice care.
  • Medical insurance (Part B) that helps pay for doctors’ services and many other medical services and supplies that are not covered by hospital insurance.
  • Medicare Advantage (Part C) plans are available in many areas. People with Medicare Parts A and B can choose to receive all of their health care services through one of these provider organizations under Part C.
  • Prescription drug coverage (Part D) that helps pay for medications doctors prescribe for treatment.

For most beneficiaries, the government pays a substantial portion—75 percent—of the Part B standard premium and the beneficiary pays the remaining 25 percent.

Beginning in 2007, the government portion was reduced for higher income beneficiaries who began paying a larger percentage of the premium based on income …  In 2008, higher income beneficiaries will be responsible for 67 percent of their income-related adjustment. By 2009, the end of the transition period, these higher income beneficiaries will pay a monthly premium equal to 35, 50, 65, or 80 percent of the total Part B cost, depending on their income level.   However, the law is expected to affect only about 4 to 5 percent of Medicare beneficiaries, so most people will continue to pay the standard premium, without an income-related adjustment.

* * * * *

Want more from the Homa Files?
 
Click link =>  The Homa Files Blog

* * * * *

Oil – Dying a natural death ?

August 12, 2008

According to the Institute for Energy Research, the Congressional ban on off-shore oil development dies a natural death on Sept. 30, 2008 … unless new legislation extends it. 

I’m skeptical since the eagle-eyed press hasn’t reported this, but if it’s true that the ban ends without Congressional action, every single member of Congress will have to go on record either for or against offshore drilling — right before their elections.

Things could get very interesting.

* * * *

From the IER web site:

“American oil and gas leasing has been prohibited on most of the OCS since the 1982.  Today, 97 percent of America’s offshore OCS lands are not leased for energy exploration or production.  The U.S. is now the only developed nation in the World that restricts access to its offshore energy resources.

The were two federal bans that kept the U.S. from producing its vast offshore energy resources: an executive ban and a legislative ban. Neither have the force of permanent law.

On July 14, 2008 President George W. Bush lifted the executive ban on offshore drilling, leaving only the Congressional ban.

The Congressional Moratorium comes in the form of an annual appropriations rider in Congress. It must be renewed annually by a vote in the Congress, which has enacted OCS leasing moratoria every year since 1981.

Unless Congress approves a new rider – and the President signs into law a bill that includes the rider – the Congressional ban will expire on September 30, the end of the federal FY2008 fiscal year.”

Worth exploring:
http://www.instituteforenergyresearch.org/cleaning-up-the-environment-one-more-reason-to-develop-the-outer-continental-shelf/

* * * * *

Want more from the Homa Files?
Click link =>
  The Homa Files Blog

* * * * *

Oil: Fishing where the fish are …

August 12, 2008

Excerpted highlights from IBD, “Don’t Ask, Don’t Drill”, Aug. 11, 2008

In 1970, a mere 17% of offshore wells struck oil. By 1997 that figure was up to 48%.In October 1999, the Department of Energy reported that with 3-D seismic technology overall impacts of exploration and production are reduced because fewer wells are required to develop the same amount of reserves.With even newer 4-D surveying techniques using satellites, about 70% of 4-D wells find oil. These new techniques allow us to find more oil more quickly with minimal environmental impact.

* * * * *

According to a poll released July 30 by Public Policy Institute of California, 51% of Californians are now in favor of new offshore drilling off their coast for the first time in nearly three decades.

The Minerals Management Service estimates there are 10 billion barrels waiting off the California coast.”California could actually start producing new oil within a year,” the Bernstein report said, because the oil is in shallow water, and drilling platforms have been there since before the moratoria.

* * * * *

Estimates of what lay beneath the 1.76 billion-acre continental shelf:

* * * * *

Full article:
http://www.ibdeditorials.com/IBDArticles.aspx?id=303344360938478

* * * * *

Want more from the Homa Files?
Click link =>
  The Homa Files Blog

* * * * *


Hmmm – If you’re going to cheat …

August 11, 2008

The mainstream media (MSM)  has been criticized (from the right) for hushing the Edward’s story during his run for the Dem presidential nomination.

The MSM dismisses charges of political bias and answers that the Enquirer (which broke the story) has low journalistic standards, that newsroom cutbacks have left the MSM understaffed, and — my favorite — that Mrs. Edward’s serious health situation evoked story-burying sympathy.

According to the Washington Post:

* * * * *

The Lesson from the Edward’s Affair:

If you’re a high profile politico with a healthy wife, don’t cheat on her or the press will rat you out. 

If you’re a high profile politico with an unhealthy wife, not to worry, the press won’t rat you out — out of sympathy for your ailing wife.

* * * * *

Side note: The public editor of the NY Times assured readers that liberal bias had nothing to with his paper’s refusal to run the story … and asserted that the Times front page story reporting a factless rumor of a McCain affair is not a moral equivalent. 
http://www.nytimes.com/2008/08/10/opinion/10pubed.html?_r=1&scp=1&sq=mccain%20affair&st=cse&oref=slogin

I guess because Cindy McCain is healthy …

* * * * *

Want more from the Homa Files?
Click link =>
  The Homa Files Blog

* * * * *

Taxes – Those poor folks living in New Jersey …

August 11, 2008

Well, based on data from the Tax Foundation, it’s really the rich folks living in NJ (and NY, CT, MD, and HI) that have the problem: they pay the highest state and local taxes in the country — a point or two higher than the national average 9.7%.

Add that to the federal income tax rate — with a top bracket rate of 35% that’s possibly going to 39.5%; Social Security & Medicare “contributions” that total 15.3% for the  first $102,000 in income (counting employers’ matching payments) … and you’re suddenly talking real money.

* * * * *

Reminder: State & Local taxes are disallowed “preference items” when folks calculate their Alternative Minimum Tax

* * * * *

click table to make it bigger

click table to make it bigger

click table to make it bigger

click table to make it bigger

Adapted from:Tax Foundation data:
http://www.taxfoundation.org/taxdata/show/336.html 

* * * * *

Want more from the Homa Files?
 
Click link =>  The Homa Files Blog

* * * * *

Marketing – When Teens Tighten their Wallets

August 8, 2008

Excerpted from WSJ: “Retailers Catch Teenage Blues”, August 8, 2008

Teens may dread going back to school, but the retail chains catering to them eagerly await this season for a reliable boost from kids who need new clothes. In this slow economy, however, teen retailers are showing signs of stress and beginning to worry that the late-summer boom might not arrive this year.

The teen stores have long been considered recession-resistant because young customers’ spending — often linked to allowances and summer jobs — typically holds constant in a slow economy. Back-to-school purchases were viewed as a must for taste-fickle teens who often cajole their parents in August and September into giving them extra cash.

The July results show that this year’s economic slowdown is dealing wider blows. The principal culprit: energy prices, which analysts say are fast stripping teens of their ability to buy the gas they need to get to the malls where many of these stores are located.

Strong performance in junior apparel from Wal-Mart, the world’s largest retailer, suggests it might be taking sales away from teen retailers.

For many retailers, this time of year is typically the second most profitable of the year. If performance is down this fall, it could be an unpleasant preview of what is usually the chains’ most promising time of year, the holiday season.

The industry appears divided on how to respond.

Middle-end stores like Hot Topic and American Eagle already are looking to promotions in the middle of the back-to-school selling season.

But higher-end operations like Abercrombie appear to be clinging to their price points, a bet that its brand name can weather the storm and competition with department stores. Abercrombie “prides itself being an aspirational brand, and part of that is not to mark down and have sale events. They feel like that dilutes brand equity.”

Other stores are learning to sit pretty at lower price points. Teen retailer Aeropostale Inc. is running a fleet of more than 800 stores throughout the U.S. with clothing styles not too dissimilar from those found at Abercrombie — but at prices about 30% lower.

Other chains are taking a fast turn toward markdowns

It is unclear whether these moves will be enough to lure young buyers back into the mall. Megan Tysoe, a 19-year-old Georgetown University student, says she spent $300 a month on clothes last summer using paychecks from a summer job. But this year she is working an unpaid internship as a paying job couldn’t be found. And Ms. Tysoe has words that should cause worry for retailers: “Instead of buying new things, my friends trade clothes with each other.”

Full article:
http://online.wsj.com/article/SB121810860555720233.html?mod=hps_us_whats_news

* * * * *

Want more from the Homa Files?
 
Click link =>  The Homa Files Blog

* * * * *

Energy – The Case for Doing Everything

August 8, 2008

Excerpted from “It’s Simple: Drill and Conserve”, by Charles Krauthammer.  Aug. 08, 2008

Americans’ greatest concern is the economy, and their greatest economic concern is energy (by a significant margin: 37 percent to 21 percent for inflation). By an overwhelming margin of 2-1, Americans want to lift the moratorium preventing drilling on the Outer Continental Shelf, thus unlocking vast energy resources shut down for the last 27 years.

(Some) say that we cannot drill our way out of the oil crisis. Of course not. But it is equally obvious that we cannot solar or wind or biomass our way out. Does this mean that because any one measure cannot solve a problem, it needs to be rejected?

Why must there be a choice between encouraging conservation and increasing supply? The logical answer is obvious: Do both.

Do everything. Wind and solar. A tire gauge in every mailbox. Hell, a team of oxen for every family (to pull their gasoline-drained SUVs). The consensus in the country, logically unassailable and politically unbeatable, is to do everything possible to both increase supply and reduce demand, because we have a problem that’s been killing our economy and threatening our national security. And no one measure is sufficient.

The “green fuels” … are as yet uneconomical, speculative technologies, still far more expensive than extracted oil and natural gas. We could be decades away. And our economy is teetering. Why would you not drill to provide a steady supply of proven fuels for the next few decades as we make the huge technological and economic transition to renewable energy?

Fine, let’s throw a few tens of billions at such things as electric cars and renewablesis and see what sticks. But (understand that) success will not just require huge amounts of money. It will require equally huge amounts of time and luck.

On the other hand, drilling requires no government program, no newly created bureaucracy, no pie-in-the-sky technologies that no one has yet invented. It requires only one thing, only one act. Lift the moratorium. Private industry will do the rest. And far from draining the treasury, it will replenish it with direct taxes, and with the indirect taxes from the thousands of non-subsidized new jobs created.

(In the energy debate), the argument for “do everything” is not rocket science. It is common sense. 

Full commentary:
http://www.realclearpolitics.com/articles/2008/08/drill_and_conserve.html

* * * * *

Want more from the Homa Files?
 
Click link =>  The Homa Files Blog

* * * * *

Forget Buffett’s Low Tax Rate — How about those Hedge Funds?

August 8, 2008

In a prior post, I hypothesized that Warren Buffett’s guilt-ridden 17.7% effective Federal tax rate is most likely a consequence (unintended ?)  of the capital gains tax rate cut and  the functional failure of the AMT to do its job.

Another group of low capital gains tax rate benificiaries shows no Buffett-like remorse: private equity partnerships, and their close cousins, the hedge funds.

* * * * *

In brief, hedge funds are partnerships and are legally positioned to benefit from favorable capital gains tax treatment.  But, hedge funds cavalierly push the law to the limits with some contested schemes.

Specifically, hedge funds have made an art form of “carried interest” — a claim that current operating income should be classified as returns on their invested capital and then taxed at capital gains rates (which are, of course, much lower than regular income rates.

Many (most? all?) disinterested observers smell a rat — a Enron-like loophole that you can drive a truck through.

Why doesn’t the loophole get closed?  Simple politics.  Sen. Shumer (NY) keeps blocking action because he fears hedgers will head off-shore, and — some cynics reckon — stop their super-sized contributions to the Democratoric Senatorial Re-election Committee — which, coincidentally, Shumer runs.

The likely fix: raising everybody’s capital gains rates — to avoid the appearance of singling out a prized political support group. 

* * * * *

For details re: carried interest, below are summaries and links to a couple of good sources.

* * * * *

Carried Interest – The Issue

From : Senate Testimony: “The Taxation of Carried Interest”
by Peter R. Orszag, CBO Director
July 11, 2007

“A growing amount of financial intermediation is occurring through private equity and hedge funds, which are typically organized as partnerships or limited liability companies and … are growing rapidly for many reasons, including their tax advantages over traditional financial services corporations.

A general partner of a private equity or hedge fund typically receives two types of compensation: a management fee tied to some percentage of assets under management and “carried interest” tied to some percentage of the profits generated by those assets.

The management fee is taxed as ordinary income to the general partner. Taxation on the carried interest is deferred until profits are realized on the fund’s underlying assets, and any resulting profits to the general partner are taxed at the capital gains tax rate …

Most economists, however, would view at least part and perhaps all of the carried interest as performance-based compensation for management services provided by the general partner rather than a return on financial capital invested by that partner … and suggest taxing at least some component of the carried interest as ordinary income, as most other performance-based compensation is currently treated …

Much of the complexity associated with the taxation of carried interest arises because of the differential between the capital gains tax rate and the ordinary income tax rate, which creates an incentive to shift income into a form classified as capital gains. Further widening of the differential between the taxation of ordinary income and of capital gains would create even stronger incentives to shift income into the tax-preferred capital form.

Full testimony (worth reading):
http://www.cbo.gov/ftpdocs/83xx/doc8306/07-11-CarriedInterest_Testimony.pdf

* * * * *

Carried Interest – The Politics

According to Bloomberg:

Democratic Senator Charles Schumer of New York is fighting a plan to raise taxes on hedge funds and buyout firms with his own legislative poison pill …  saying that he would agree to the proposals only if taxes were also raised on oil-and-gas, venture-capital and real-estate partnerships.

Schumer may be trying to shield both his Wall Street constituents [i.e. keeping jobs in NYC] and his party’s electoral war chest … based on federal filings, contributions from employees of private-equity firms and hedge funds to the Democratic Senatorial Campaign Committee, which Schumer heads ,,, far exceed the industry’s contributions to the Republican Senate committee.

http://www.bloomberg.com/apps/news?pid=20601103&sid=a9DpYagBpVIo&refer=us

* * * * *

Want more from the Homa Files?
 
Click link =>  The Homa Files Blog

Paris be gone ! A bigger celeb walks the energy talk.

August 8, 2008

Friday cheapshot:

I usually don’t put much stock in celebrity endorsements. 

But in marketing parlance — this one, from a star who was way ahead oh his time — might have “legs” …


click picture to make it bigger

 * * * * *

Questions:

1. Wouldn’t it be faster for Fred to leave the car at home and  just walk to work ?

2. Are rock hard wheels more enegy efficient than fully inflated tires ?

* * * * *

Want more from the Homa Files?
 
Click link =>  The Homa Files Blog

* * * * *