Archive for the ‘Polls & Surveys’ Category

Obama dives below the Mendoza line …

November 24, 2010

Talk about a bad day.

The President got the 3 a.m. phone call (you do remember Hillary’s campaign ad, don’t you) informing him that North Korea fired on South Korea.  

Besides creating a threat to world peace, the act of aggression sucked all of the oxygen out of the day’s news cycle.

That hurt, because O was heading for Kokomo to cheerlead the recovering economy and do a GM-IPO victory dance.

Oops.

Then the Fed announces that it’s cutting its growth forecast for 2010 and 2011.

To make matters even worse, Gov’t Motors shares tumbled about a buck, heading down below last weeks offering price.

Then the coup de grace: Zogby releases polling results showing the President’s approval rating dipping below the Mendoza Line.

In baseball, a .200 batting average is nicknamed the “Mendoza Line”.

A batting average below the Mendoza Line is considered unqualified for the pros, even if a player has strong fielding skills.

The Presidential equivalent is an approval rating of 40%

Well, according to the latest Zogby poll, Pres Obama has fallen below the Presidential Mendoza line.

Uh-oh.

image

http://zogby.com/news/ReadNews.cfm?ID=1924

Other – more reliable polls – peg Obama’s approval in the mid-40s … so, I take Zogby with a grain of salt. 

But, the Zogby results give me an opportunity to talk about the Mendoza Line … an opportunity that just can’t be passed up.

Dancin’ in the streets: 61% think election results are positive for the country …

November 19, 2010

According to a recent WSJ poll …

Question: Overall, how do you feel about the results of this year’s elections — do you feel they are very positive for the country, somewhat positive, somewhat negative, or very negative for the country?

image

http://online.wsj.com/public/resources/documents/WSJpoll111710.pdf

Update: But they like him as a person, and like Michelle even more … oh, really?

October 28, 2010

This one has perplexed me for a awhile.

The constant refrain is that a people don’t like Obama’s policies, but they like him as a person.

Well, in  the most recent CBS/NYT (left-leaning) poll, Obama’s job approval was 47% ,,, his personal approval was 40%.

Hmmm.

And about Michelle being way more popular than Barack …

Her personal approval scores 41% favorable … a point better than her hubby.

Now, to be fair, 73% of folks who have a point of view on her rate her favorably (41% / 56%) … but, she’s a total non-factor to 41%.

image

image

http://www.cbsnews.com/stories/2010/10/27/politics/main6997687.shtml?tag=contentMain;contentBody

1 in 3 Dems give O a negative job approval rating … whoa, Nellie.

October 27, 2010

The headline from the most recent Harris Interactive poll is that President Obama’s job approval rating dipped to 37% — the lowest (I think) in any poll.

More interesting than the total number is his slipping approval among self-identified Dems and Liberals … 1 in 3 of them dings the President.

For comparison, 90% of GOPers and 89% of conservatives disapprove of the job the President is doing.

image

Better president — Obama or Bush ?

October 12, 2010

Bottom line : According to a CNN poll, public perceptions are a tie — within the margin of statistical error — … Obama 47%, Bush 45% Question and numbers below.

Commentary form UK’s Telegraph says it all:

Yes, President Bush, America does miss you

The CNN poll is of course deeply humiliating for the White House, especially coming just three and a half weeks before the November mid-terms. George W. Bush’s resurgence is in large part due to mounting opposition to the Obama’s presidency’s left-wing agenda, but it is also spurred by Obama’s image as an out of touch, aloof and elitist president, divorced from economic and political reality on the ground.

A lot of Americans frankly miss the down-to-earth and significantly warmer leadership style promoted by President Bush, as well as his unfailing sense of optimism and heart-felt pride in America on the world stage. You certainly won’t ever find Bush apologising for his country or extending the hand of friendship to her enemies.

And when Bush’s memoir “Decision Points” is published on November 9th, I’m in no doubt it will storm The New York Times’ bestseller list riding a new wave of nostalgia for his time in office. George W. Bush is back in fashion with a vengeance, in marked contrast to his increasingly unpopular successor in the White House.

Telegraph, Yes, President Bush, America does miss you, October 8th, 2010 
http://blogs.telegraph.co.uk/news/nilegardiner/100058215/yes-president-bush-america-does-miss-you/

* * * * *
Question: All in all, do you think Barack Obama has been a better president than George W. Bush, or do you think Bush was a better president than Obama has been?

image

http://i2.cdn.turner.com/cnn/2010/images/10/08/rel14a.pdf

From a high of 91% to a low of 12% …

October 5, 2010

Most media reports highlight President Obama’s average job approval.

A recent Gallup survey reports Presidential Approval across major segments and blocs.

Some highlights:

  • Blacks 91 %, Hispanics 55%, Whites 36%
  • 18 to 29 year olds 57%, over 65 year olds 28%
  • East coasters 52%, Southerners 41%
  • Income < $24,000 51%,  income $60,000 to $90,000 43%
  • Dems 79%, GOP 12% 

wvpdkfnsgesg06umyqcesw.gif

http://www.gallup.com/poll/143354/Obama-Approval-Averages-September.aspx?utm_source=alert&utm_medium=email&utm_campaign=syndication&utm_content=morelink&utm_term=Politics

"Young People and Minorities Are All the President Has Left"

October 4, 2010

That’s the headline on the National Journal’s new poll of Americans, conducted with the Pew Research Center.

Digging into the details:

  • Obama still retains support among voters under 30 , but even there his excellent or good job rating is only 45%, as opposed to 47% who rate him fair or poor.
  • His worst numbers are with voters aged 50 to 64, only 34% of whom rate him positively.
  • Minority voters are still solidly behind the president, with 76% of blacks expressing approval. A majority of Hispanic voters also still approve.
  • Among non-Hispanic whites, the bottom has dropped out. Only 30% score Obama positively, with 66% rating him fair or poor.
  • White women who are college graduates give Obama a 39% positive job rating; 31% of white men with a similar educational background do.
  • Only 31% of white women without a college degree rate the president well; only 22% of men without a college degree .

WSJ, For Obama, Even the Good News Is Bad, Sept. 30, 2010
http://online.wsj.com/article/SB10001424052748704116004575522160145340470.html?mod=WSJ_Opinion_MIDDLETopOpinion


They don’t like his policies, but they still like him … oh yeah ?

October 1, 2010

The refrain that ‘Obama is still personally popular’ is repeated so often — especially in the mainstream media — that it’s treated as a universal truth.

Unfortunately (for Obama) the facts don’t support the contention.

Based on the latest WSJ-NBC poll :

  • 47% of people feel positively towards Obama … 29% very positively
  • The 47% is down from 64% on Inauguration Day
  • 41% of people feel negatively towards Obama … 27% very negatively
  • The 41% is up from 19% on Inauguration Day

My take:

  • People started out liking him, but …
  • Less than half now feel positively towards the guy
  • Numbers correlate pretty well with his job approval

Question: how would you feel if half the people who knew you felt negatively about you ?

Bummed, right ?

So why do the pundits keep saying he’s one popular dude ?

I must be missing something …

http://online.wsj.com/public/resources/documents/WSJNBCPoll09282010.pdf

About Obama’s attacks on John Boehner …

September 30, 2010

I’m not a big John Boehner fan, but from the get-go, Obama’s personal attacks on the House Minority Leader  struck me as one of the Administration’s wackiest campaign tactics.

Based on the latest WSJ-NBC poll :

  • 50% don’t know who John Boehner is …
  • Of those that do know who he is … 28% view him favorably, 34% view him unfavorably, 38% have no opinion on him.
  • Combined, over 2/3s (69%) either don’t know who Boehner is or have no opinion of him.

Why would you focus an attack on a guy that nobody knows ?

I must be missing something …

http://online.wsj.com/public/resources/documents/WSJNBCPoll09282010.pdf

Ready to pull the lever for Mitch Who ?

September 29, 2010

A couple of tidbits from the Politico-GWU poll that’s been getting some play on the talk shows …

35% strongly approve of Pres Obama’s job performance; 45% strongly disapprove  … an 10 point gap.

But, 47% strongly approve of Mr. Obama “as a person”  … leading pundits to consistently conclude that he remains personally popular but his policies are unpopular.

That’s true … 46% personal approval is higher than 39% job approval.

But, my question: anybody notice that less than half of folks strongly approve of him as a person.

That doesn’t strike me as remarkably “still popular”.

* * * * *

75% of the people surveyed don’t know who Mitch Daniel’s — governor of Indiana —  is.

When asked: who would you vote for in the next Presidential election: Obama or Daniels … Obama wins 38% to 26%.

Since more people are willing to vote for Daniels than know who he is, it says that some (many ?) people will vote for anybody who isn’t Obama.

Hmmm …

* * * * *

Of MSNBC’s powerhouse prime time line-up:

  • 42% don’t know who Keith Olberman is.
  • 55% don’t know Rachel.Maddow
  • 70% don’t know Ed Shultze 

Source:
http://www.politico.com/static/PPM156_bg_41_questionnaire.html

What per cent of Americans “always or usually” live from pay check to pay check ?

September 13, 2010

Answer:

Recent polls show that 61%of Americans “always or usually” live from pay check to pay check … up from 49% in 2008.

Source:
http://www.ft.com/cms/s/0/44d4b1c4-b52f-11df-9af8-00144feabdc0.html

GOP lead “largest in Gallup’s history” …

August 31, 2010

Republicans lead by 51% to 41% among registered voters in Gallup weekly tracking of 2010 congressional voting preferences.

The 10-percentage-point lead is the GOP’s largest so far this year and is its largest in Gallup’s history of tracking the midterm generic ballot for Congress.

image
http://www.gallup.com/poll/142718/GOP-Unprecedented-Lead-Generic-Ballot.aspx

Recovery Summer Tour Update: Approval of O’s handling of the economy takes another hit.

August 20, 2010

According to the latest left-leaning AP—GTK poll, 16% strongly approve of the way that President Obama is handling the economy; 41% strongly disapprove.

image

http://www.ap-gfkpoll.com/pdf/AP-GfK_Poll_August_Topline_081710.pdf

But people still like him …

August 13, 2010

Thur morning on CNBC, John Harwood – one of NBC’s political hacks – reported on the most recent WSJ/NBC survey.

He rote-repeated the regular lib refrain: yes, the President’s approval ratings have fallen because people don’t like his policies … but people still like him as a person.

Oh, really ?

The WSJ/NBC survey asked people to “rate your feelings towards President Obama as very positive, somewhat positive, neutral, somewhat negative, or very
negative
.”

The WSJ/NBC data does say that 46% have “net positive” feelings towards Obama … 41% have “net negative” feelings towards him. 

So, he has a plurality but not a majority.

  • Technical Note: “Net Positive” adds together “Very Positive” and “Somewhat Positive”; “Net Negative” adds together “Very Negative” and “Somewhat Negative”;

In February 2009, Obama’s net positive was 68%; his net negative was 19%.

In other words – from February 2009 to August 2010 – Obama’s net positives dropped by 22 points and his net negatives increased by 22 points.

More significant, Obama’s top & bottom box ratings have converged.

In February 2009, 47% felt “very positive” towards him … only 19% felt “very negative”.

Now, 27% feel “very positive” towards him (a drop of 20 points) … and 27% feel “very negative” (up 8 points). 

Looks to me like folks aren’t liking him as much as they used to …

image

http://msnbcmedia.msn.com/i/MSNBC/Sections/NEWS/A_Politics/___Politics_Today_Stories_Teases/Aug%20NBC-WSJ%20Filled-in%20_for%208-11-10%20release_.pdf

Wasn’t suing Arizona supposed to help Obama with Hispanics ?

August 9, 2010

Oops … According to Gallup, President Obama’s ratings have slipped among Hispanics … 

click chart to enlarge

image

http://www.gallup.com/poll/141725/Blacks-Whites-Continue-Differ-Sharply-Obama.aspx

Melting down … despite “The View”.

August 5, 2010

For the first time a majority in the Real Clear Politics poll-of-polls disapprove of the way President Obama is handling his job.

And, for the first time, his averaged approval rating has dipped below 45%.

image

image

History repeats … here’s evidence

August 4, 2010

In the most recent Gallup — USA Today presidential tracking poll, Pres. Obama’s approval dropped to 41% — just above the political “Mendoza Line ”.

More interesting (to me), is the remarkable similarity between Obama’s approval decline and that of the President  to which he is most often compared (by conservatives) — Jimmy Carter.

  • Note: Jimmy Carter’s line is the one with the initial spike.

Anybody see a pattern ?

image

http://www.usatoday.com/news/washington/presidential-approval-tracker.htm

Voters’ shifting ideology …

August 2, 2010

Today …

  • 58 percent of voters see Democrats as liberal or very liberal, while 56 percent see Republicans as conservative or very conservative
  • 60 percent of Democrats place the Republican Party to the right of where they place themselves
  • 42 percent of Democrats self-identify as liberal or very liberal
  • 24 percent of Democrats describe themselves as conservative or very conservative
  • 83 percent of Republicans see the Democratic Party as more liberal than they themselves are
  • 65 percent of Republicans think of themselves as conservative or very conservative
  • 5 percent of Republicans call themselves liberal or very liberal

In 2005 …

  • 51 percent of Independents thought that the Republican Party was more conservative than they themselves were
  • 36 percent thought that the Democratic Party was more liberal.
  • Independents considered the Republican Party to be twice as distant from them ideologically as the Democratic Party.

Today …

  • 56 percent of Independents see the Democratic Party as more liberal than they themselves are
  • 39 percent see the Republican Party as more conservative.
  • Independents see the Democratic Party as three times farther away from them ideologically as the Republican Party.

How Americans’ Shifting Political Ideologies Threaten the Democrats, July 28, 2010
http://www.tnr.com/blog/william-galston/76631/democrats-republicans-popularity-new-demographics

He may not pay attention to the polls, but we do …

July 28, 2010

President Obama is bumping against a couple of threshold numbers.

According to the Pollster.com’s poll-of-polls:

  • 49.9% of Americans now disapprove of the job that Obama is doing as President
  • Less than 46% of Americans now approve of the job that he’s doing.

The numbers are comparable in the RealClearPolitics.com poll-of-polls. 

Both Pollster and RCP are displayed below ….

image

image

image

Celebrating success: Georgetown ranked #9

July 28, 2010

No, not hoops or b-school rankings, we’re talking the Most Gang-Affiliated Hats in Sports.

According to Complex.com, here are the top 10:

#10 Oakland A’s
Adopted by: Almighty Ambrose Nation (Chicago), Orchestra Albany (Chicago), Spanish Cobras (Chicago)
Why: The Ambrose and the Albany share the same first letter as the Athletics, while the Spanish Cobras rock the green A’s caps to represent their primary color.

#9 Georgetown Hoyas
Adopted by: Gangster Disciples (Chicago), Folk Nation (Chicago)
Why: GD members started rocking Georgetown gear to honor founder Larry Hoover, with Hoyas standing for “Hoover’s On Your Ass.”

#8 Minnesota Twins
Adopted by: Maniac Latin Disciples (Chicago)
Why: The M stands for “Maniac Latin Disciples”.

#7 Detroit Tigers
Adopted by: Gangster Disciples (Chicago)
Why: The “D” stands for Disciple and the GD colors are black and blue.

#6 Houston Astros
Adopted by: The Bloods (L.A.), Folk Nation (Chicago)
Why: The red cap is an easy color identifier for the Bloods. For the Folk Nation, the five-point star represents their symbol.

#5 Los Angeles Kings
Adopted by: Latin Kings (Chicago, NYC), People Nation (Chicago)
Why: The word “Kings” makes it easy to identify the largest Hispanic gang in the U.S. For other gangs within the People Nation alliance, the “Kings” stands for “Kill Inglewood Nasty Gangsters.”

#4 Chicago Bulls
Adopted by: Vice Lords (Chicago), Latin Counts (Mexico, Chicago), Mickey Cobras (Chicago), Black P. Stone Nation (Chicago), The Bloods (L.A.)
Why: The Vice Lords, Latin Counts, and Mickey Cobras share the Bulls’ colors of red and black. The P. Stones and the Bloods were a little more creative however: For the former, “Bulls” stands for “Boy U Look Like Stone” and for the Bloods, it stands for “Bloods Usually Live Life Strong/Smart.”

#3 Los Angeles/Oakland Raiders
Adopted by: People Nation (Chicago), Folk Nation (Chicago)
Why: For the Folk Nation, “Raiders” stands for “Ruthless Ass Insane Disciples Running Shit.” For the People Nation, it stands for “Raggedy Ass Iced Donuts Everywhere Running Scared.” Ha!

#2 Cincinnati Reds
Adopted by: 4 Corner Hustlers (Chicago), The Bloods (L.A.)
Why: The Bloods wear it for color association. The Hustlers put a “4” next to the “C” and an “H” inside the “C.”

#1 Los Angeles Dodgers
Adopted by: The Crips (L.A.), Gangster Disciples (Chicago), Latin Aspects (various)
Why: The Crips use it for color association. For the GDs, the “D” stands for Disciple. For the Aspects, the “LA” stands for Latin Aspects.

Full article:
http://www.complex.com/blogs/2010/07/23/rep-yo-set-the-10-most-gang-affiliated-hats-in-sports/

Shocker: Folks think concert tickets are too expensive …

July 26, 2010

Seventy percent (70%) of adults think concert ticket prices are too high

…  and they’re voting with their wallets

… only 35% say they have attended a music concert in the last year.

Source: Rasmussen Reports, 70% Say Concert Tickets Cost Too Much, July 25, 2010
http://www.rasmussenreports.com/public_content/lifestyle/entertainment/july_2010/70_say_concert_tickets_cost_too_much

The thrill is gone … or at least going.

July 23, 2010

From the just released CNN poll …

Headline: Obama’s approval drops to 47% (from 51%)

I was most intrigued by the the following question:

How do you personally feel about the fact that Barack Obama is president?

If you had to choose one of the following descriptions, would you say you feel thrilled, happy, don’t care, unhappy or depressed?

* * * * *

Among all Americans, more are depressed that Obama is President than are thrilled – 14% (up from 4%) to 13% (down from 28%)

click table to enlarge

image

* * * * *

Among whites, more half are unhappy or depressed that Obama is President  …

click table to enlarge

image

* * * * *

Among blacks, 39% are thrilled … down from 61% on Inauguration Day.

Note: Still, over 90% of Blacks approve of the job Pres. Obama is doing … but, given the decline in those thrilled, the intensity of the approval is diminishing.

click table to enlarge

image

http://i2.cdn.turner.com/cnn/2010/images/07/22/rel10a9b.pdf

For Obama, the chasm gets wider …

July 22, 2010

The headline from yesterday’s Quinnipiac University National Poll:
Obama Approval Drops To Lowest Point Ever
… 44% approve,  48% disapprove

And, when asked:  If the 2012 election for President were being held today, do you think you would vote for Barack Obama the Democratic candidate, or the Republican candidate? The unnamed ‘any’ GOP candidate beat Obama 39% to 36%. That can’t be good for the President.

Still, the bigger deal is the split by race, age, and income …

* * * * *

Approval among Blacks is still a sky high 91%,
but approval among whites has slipped below 40%
… a 54 point difference — that’s big.

image

* * * * *

Approval among young Americans has dipped below 50%
… approval among old folks like me has slipped below 40%

image

* * * * *

Approval among young Americans has stayed around 50%
…  a majority of those earning more than $50,000 (think “pay income taxes”) disapprove

 image


http://www.quinnipiac.edu/x1295.xml?ReleaseID=1478

Where are Obama’s approval ratings highest ? … and lowest ?

July 21, 2010

Interesting recap by Gallup …

DC leads with a sky high 85% approval  … Wyoming’s 29% is the lowest.

image

image

image

http://www.gallup.com/poll/141428/Obama-Highest-Half-Year-Approval-Ratings-Hawaii.aspx

Flash: O’s morning after polling …

June 16, 2010

According to this morning’s Rasmussen poll results …

Overall, 42% of voters say they at least somewhat approve of the president’s job performance.

That’s the lowest level of approval yet recorded for this president.

The president’s approval rating has held steady in the 46% – 47% range for six months.

It remains to be seen whether this new low is merely statistical noise or the start of a lasting change.

image

Full report:
http://www.rasmussenreports.com/public_content/politics/obama_administration/daily_presidential_tracking_poll

Rasmussen: Majority of Americans trust GOP more on Health Care …

April 13, 2010

Punchline: Voters now trust Republicans more than Democrats on nine out of 10 key issues regularly tracked by Rasmussen Reports

* * * * *

Excerpted from Rasmussen: 53% Now Trust Republicans More Than Democrats on Health Care, Saturday, April 03, 2010

Following the passage of the health care bill, 53% now say they trust Republicans on the issue of health care. Thirty-seven percent (37%) place their trust in Democrats.

A month earlier, the two parties were essentially even on the health care issue.

* * * * *

Which party do you trust more on the following issues?

image
http://www.rasmussenreports.com/public_content/politics/mood_of_america/trust_on_issues

Glub-glub … O’s back under water again.

April 12, 2010

Pres. Obama had a small bounce from the enactment of ObamaCare, but it was very short lived.

Now, Gallup — which leans slightly left — has a plurality of Americans disapproving of the job he’s doing as president — 48% disapproving to 45% approving.

image

http://www.gallup.com/poll/113980/Gallup-Daily-Obama-Job-Approval.aspx

* * * * *

Similarly, the Real Clear Politics “poll-of-polls” has the President upside-down by 1.2 points — 47.3% disapproving, 46.1% disapproving.

image
http://www.realclearpolitics.com/epolls/other/president_obama_job_approval-1044.html

* * * * *

And according to Pollster.com’s poll-of-polls,  Obama’s approval rating among Independents is 9.2 points under water — 39.8% to 49%

image

Obama’s post-healthcare bump … going, going, ….

March 29, 2010

Gone !

This week, the left-leaning media has been trumpeting the bump that Pres Obama and his healthcare plan have gotten from passage of ObamaCare.

Perhaps the high fives were a tad premature.

Pollster.com’s poll-of-polls shows that — immediately after the vote — there was a bump of a couple points in people favoring the bill.

The approvers were still in the minority, and disapprovers outnumbered approvers.

But, the approvers number has fallen back to pre-vote levels.

image 
http://www.pollster.com/polls/us/healthplan.php

* * * * *

What about Obama’s approval numbers?

There was a positive bump of about 5 percentage points in the days after the vote.

But, the numbers seemed to have turned back around.  According to Gallup, the 5 points are gone  — and the approver and disapprovers are tied at 46% — just as they were before the vote.

Why ? My guess is that the publicity surrounding the enormous corporate write-offs related to the bill is resonating … people may be sensing that ObamaCare isn’t free after all and that they may be the ones paying for it — either by losing benefits or losing their jobs or both.

image 

* * * * *

Most interesting (to me) is the movement among folks who strongly approve or disapprove.

There has been a 5 point bump is strong approvers, suggesting that Obama did, in fact, rally his base.

But, the level of strong disapprovers has remained in a pretty tight range and is trending upwards, indicating that few people who opposed ObamaCare before the vote has been won over, and that the intensity of disapproval remains quite high

image
http://www.rasmussenreports.com/public_content/politics/obama_administration/obama_approval_index_history

Consensus of majors polls: Obama is officially "under water" …

March 19, 2010

For the first time in his Presidency, more people disapprove of the job that Obama is doing as president than approve. 

His rating has been “upside down” in right-leaning Rasmussen for awhile. 

Now, the left-leaning and consensus polls agree …

Here are the facts, draw your own conclusion.

(Hint:The bad economy has been a constant, so don’t blame it for recent declines)

* * * *

Pollster.com “poll of polls”: Approve 46.4%, Disapprove 48.8%, Deficit(2.4%)

image
http://www.pollster.com/polls/us/jobapproval-obama.php?xml=http://www.pollster.com/flashcharts/content/xml/Obama44JobApproval.xml&choices=Disapprove,Approve&phone=&ivr=&internet=&mail=&smoothing=&from_date=&to_date=&min_pct=&max_pct=&grid=&points=1&lines=1&colors=Disapprove-BF0014,Approve-000000,Undecided-68228B

* * * * *

RealClearPolitics “poll of polls”: Approve 47.3%, Disapprove 47.8%, Deficit(.5%)

image
image

http://www.realclearpolitics.com/epolls/other/president_obama_job_approval-1044.html

* * * * *

Gallup: Approve 46%, Disapprove 48%, Deficit(2%)

image
http://www.gallup.com/poll/113980/Gallup-Daily-Obama-Job-Approval.aspx

* * * * *

Rasmussen Reports: Strongly Approve 23%, Strongly Disapprove 43%%, Deficit (20%)

image
http://www.rasmussenreports.com/public_content/politics/obama_administration/daily_presidential_tracking_poll

Will “swing” Congressmen vote their constituents’ will … or the party bosses’ ?

March 15, 2010

The Tarrance Group conducted polling for the districts of eleven Democrats thought to be potential flippers on the final vote on health care reform.

Below are the results for the main question, “do you favor or oppose the health care reform legislation being proposed by President Obama and the Democrats in Congress” , along with the members’ votes on the health care bill the first time around.

In summary, majorities oppose the bill in every district except one (NY-13), most of the opposers strongly oppose the bill.

  • AZ-8 (Giffords, yea): 35% favor, 52% oppose, 46% strongly oppose;
  • CO-4 (Markey, nay): 33% favor, 58% oppose, 51% strongly oppose;
  • IN-9 (Hill, yea): 31% favor, 52% oppose, 44% strongly oppose;
  • NJ-3 (Adler, nay): 34% favor, 57% oppose, 46% strongly oppose;
  • OH-1 (Driehaus, yea): 39% favor, 54% oppose, 48% strongly oppose;
  • OH-16 (Boccieri, nay): 38% favor, 51% oppose, 46% strongly oppose;
  • NV-3 (Titus, yea): 40% favor, 52% oppose, 44% strongly oppose;
  • NY-13 (McMahon, nay): 40% favor, 46% oppose, 37% strongly oppose;
  • NY-24 (Arcuri, yea): 32% favor, 53% oppose, 47% strongly oppose;
  • PA-4 (Altmire, nay): 30% favor, 58% oppose, 47% strongly oppose;
  • PA-10 (Carney, yea): 28% favor, 58% oppose, 47% strongly oppose.

image 

http://www.naw.org/files/TargetCDHealthCareStudyToplines.pdf

Sourced from RCP: How Much Damage Could HC Inflict on Dems?, Mar 10, 2010
http://realclearpolitics.blogs.time.com/2010/03/10/how-much-damage-could-hc-inflict-on-dems/

Uh Oh: Only 1 in 4 Americans think country is on the right track …

March 8, 2010

Punch line: 25% of Americans Say U.S. Heading In Right Direction, Lowest Since Obama Took Office

* * * * *

Excerpted from Rasmussen: Right Direction or Wrong Track, March 03, 2010

Just 25% of U.S. voters now say the country is heading in the right direction, the lowest level of voter confidence since early January 2009.

69% believe the nation is heading down the wrong track, the highest level measured in 14 months.

These findings mirror those in a separate survey  that shows views of the country’s short- and long-term economic future are gloomier than they have been at any time since President Obama took office in January of last year.

Leading up to his inauguration a year ago, the number of voters who felt the country was heading in the right direction remained below 20%.

The week of his inauguration, voter confidence rose to 27% and then steadily increased, peaking at 40% in early May 2009. Confidence has declined since.

Full article:
http://www.rasmussenreports.com/public_content/politics/mood_of_america/right_direction_or_wrong_track

Stimulus work ? Elvis alive? … It’s close, but more believe the latter !

March 1, 2010

According to a CBS News poll on the 25th anniversary of Elvis Presley’s death, 7 percent of respondents believed Elvis was still living.

A CBS News/New York Times poll released a few days before the one-year anniversary of the passage of the so-called “stimulus” bill, shows that only 6 percent of respondents believe Keynesian-style spending has “created” jobs.

The Obama Administration’s claims that a depression was averted and promised  that unemployment would remain around 8 percent. Of course, unemployment surpassed 10 percent with stimulus spending.

Taxpayers seem to be looking for more proof.

Source:
http://www.unitedliberty.org/articles/5051-poll-6-of-americans-believe-stimulus-created-jobs-7-believe-elvis-is-alive

President’s "strong approvers" hits new low …

February 22, 2010

The Rasmussen Reports daily Presidential Tracking Poll for Sunday February 21 shows that 22% of the nation’s voters Strongly Approve of the way that Barack Obama is performing his role as President. That is the lowest level of strong approval yet recorded for this President.

Forty-one percent (41%) Strongly Disapprove giving Obama a Presidential Approval Index rating of -19.

The Approval Index has been lower only on one day during Barack Obama’s thirteen months in office (see trends). The previous low came on December 22 as the Senate was preparing to approve its version of the proposed health care legislation.

The current lows come as the President is once again focusing attention on the health care legislation.

http://www.rasmussenreports.com/public_content/politics/obama_administration/daily_presidential_tracking_poll

image

The elephant(s) in the middle of the room …

February 17, 2010

CNN just released a poll that that their commentators said “shocked them”. 

Bottom line: A majority of “all Americans” say that Pres. Obama does not deserve to be reelected.

Keep reading for some related diagnostics …

image
http://i2.cdn.turner.com/cnn/2010/images/02/16/rel4a.pdf

* * * * *

A reputed Quinnipiac University poll released last week concludes that American voters remain deeply divided about President Barack Obama’s job performance with 45% approving of the job he’s doing and 46% disapproving.

Their conclusion seems pretty benign, doesn’t it ? A 50/ 50 country.

Digging deeper into the ‘internals’ reveals some deeper divides …

* * * * *

Obama’s net approval among Dems is plus 67 percentage points; it’s minus 74 percentage points among GOPers.

image

* * * * *

The President is plus 7 among women, and minus 7 among men … a 14 point swing.

image

* * * * *

No surprise, younger Americans rate Obama by a plus 9; older folks are a minus 6 … a 15 point swing.

image

* * * * *

Rich and poor Americans approve of the job the President is doing by 5% and 10% respectively, but middle income Americans are net disapprovers by double digits.

image

* * * * *

A largely ignored divide is more than a bit disturbing .  Draw your own conclusions.

image

* * * * *
Full article:
http://www.quinnipiac.edu/x1295.xml?ReleaseID=1423

Yeah, but everybody still likes him …

February 16, 2010

The pundits say repeatedly that a vast majority of Americans like President Obama as a person, though many don’t like his policies.

A recent poll from CBS and the NY Times pegs the President’s job approval at a slim 46% positive to 45% disapproving. 

The same poll indicates that 39% of Americans have a ‘favorable opinion of Barack Obama’ … down from 60% a year ago … and only 5 points more than those with unfavorable opinion.  Hmmm.

CBS NEWS/NEW YORK TIMES POLL
Thursday, February 11th, 2010

image

Click to access poll_Obama_Congress_021110.pdf

Mad ? … or Mad as Hell?

February 11, 2010

People are a bit testy these days.  Here are the numbers.

* * * * *

Rasmussen Reports: 75% Are Angry At Government’s Current Policies, February 08, 2010 

Voters are madder than ever at the current policies of the federal government.

  • 75% of likely voters now say they are at least somewhat angry at the government’s current policies … 45% are Very Angry
  • 19% now say they’re not very or not at all angry at the government’s policies … 8% say they’re not angry at all 
  • 60% think that neither Republican political leaders nor Democratic political leaders have a good understanding of what is needed today.
  • Male voters are definitely angrier than women.
  • Voters earning $60,000 to $100,000 per year are more frustrated than those in any other income group.
  • 89% of Republicans are angry with the government’s current policies … 61% of Democrats share that anger
  • Older voters and higher-income voters share that believe most strongly that the current political leaders don’t have a good handle on what is needed today. .
  • Most voters oppose the now-seemingly-derailed health care plan  … and they continue to have very mixed feelings about the $787-billion economic stimulus plan.
  • 59% of voters believe cutting taxes is better than increasing government spending as a job-creation tool, but 72% expect the nation’s elected politicians to increase spending instead.
  • Eighty-three percent (83%) of Americans say the size of the federal budget deficit is due more to the unwillingness of politicians to cut government spending than to the reluctance of taxpayers to pay more in taxes.

Voters have consistently said for months that they have more confidence in their own economic judgment than that of either the president or Congress.

Full report:
http://www.rasmussenreports.com/public_content/politics/general_politics/february_2010/75_are_angry_at_government_s_current_policies

Uh-oh … the President’s lines have crossed.

January 29, 2010

For the first time, Pollster.com’s poll-of-polls has more folks disapproving of President Obama’s job performance than approving.

These numbers are post-Massachusetts, but pre-State of the Union address.

image
http://www.pollster.com/polls/us/jobapproval-obama.php?xml=http://www.pollster.com/flashcharts/content/xml/Obama44JobApproval.xml&choices=Disapprove,Approve&phone=&ivr=&internet=&mail=&smoothing=&from_date=&to_date=&min_pct=&max_pct=&grid=&points=1&lines=1&colors=Disapprove-BF0014,Approve-000000,Undecided-68228B

Trust me: Fox is the most trusted name in news … here’s the data

January 28, 2010

Punch line: A poll finds that 49 percent of Americans trust Fox News, 10 percentage points more than any other network.

Note: the polling organization PPP is the one that hit Scott Brown’s election margin on the button.

* * * * *

From Politico: Poll says Fox most trusted name in news, 1/27/10

Fox is the most trusted television news network in the country, according to a new poll out Tuesday.

A Public Policy Polling nationwide survey of 1,151 registered voters found that 49 percent of Americans trusted Fox News, 10 percentage points more than any other network.

Thirty-seven percent said they didn’t trust Fox, also the lowest level of distrust that any of the networks recorded.

CNN was the second-most-trusted network, getting the trust of 39 percent of those polled. Forty-one percent said they didn’t trust CNN.

Each of the three major networks was trusted by 35 percent or less of those surveyed, with NBC ranking highest at 35 percent. Forty-four percent said they did not trust NBC, which was combined with its sister cable station MSNBC.

Thirty-two percent of respondents said they trusted CBS, while 31 percent trusted ABC. Both CBS and ABC were not trusted by 46 percent of those polled.

Full article:
http://www.politico.com/news/stories/0110/32039.html

* * * * *

In a separate WSJ/NBC survey, almost 1 in 4 of all registered voters get most of their political information from Fox

That compares to 37% for the big 3 networks combined, and 18% for CNN.  Only 8% rely on MSNBC (whew !)

I guess the 12% “none of these” track to Jon Stewart & Steven Colbert.  (Yipes.)

image

http://msnbcmedia.msn.com/i/MSNBC/Sections/NEWS/A_Politics/___Politics_Today_Stories_Teases/10049NBCWSJ.pdf

Looking for a low-cost marketing research tool? Twitter may be your answer.

January 13, 2010

TakeAway:  In need of real-time consumer feedback?  Well, look no further.  Twitter evolved its search capabilities to allow “searchers” to not only track the volume of tweets, but also to assign a sentiment to those tweets.

* * * * *

Excerpted from, WSJ, “Follow the Tweets,” By Huaxia Rui, Andrew Whinston, and Elizabeth Winkler, November 30, 2009

There’s a new tool that can help companies predict sales for the coming weeks, or decide whether to increase inventories or put items on sale in certain stores. It’s Twitter.

Social-media sites such as Twitter have made it increasingly easy to find out what consumers think and want without the limitations and bias associated with older market-research tools … With Twitter, users broadcast what they are doing or thinking via “tweets” … People can “tweet” about anything at any time … which allows for word-of-mouth to spread at astonishing speed. Anyone can follow a user’s messages, and tweets are easily searchable using keywords …

Executives can make accurate predictions about sales trends by analyzing tweets that mention their products or services … essentially companies can monitor their “buzz” …

Imagine a company is releasing a new product into the marketplace and has spent a lot of money on advertising to create “buzz” … the company can track the buzz, determine whether the overall opinion is positive or negative and focus on specific areas of the country. The company could track the progression of tweets during and after the product’s launch to determine whether there are shifts in opinion, giving the company a chance to react quickly if there is a problem …

If executives notice a sudden surge of tweets in New York City, signaling that people will go out and buy their product over the weekend, they may want to make sure stores in the area have enough stock. Inversely, if they notice that the buzz about the product is dying out, they may decide to put the product on sale, eliminate inventory and come up with something new.

There are some challenges inherent in collecting and sorting tweets in “real time,” or as they are being sent. Twitter returns only the most recent 1,500 tweets for each keyword-search query, so if there is a sudden surge of tweets containing your keywords, you could miss some messages …

Twitter’s advanced-search feature is capable of identifying tweets as either positive or negative … Twitter determines whether a tweet has a positive or negative attitude based on “emoticons” …

Here are a few ways companies are successfully using Twitter:  1) Take note of complaints that may help improve the next generation of products and offer customer service. Listen to what Twitter users are saying about the competition and the industry in general … 2) Identify influencers … Reaching out to these Twitterers can be a key strategy for companies when launching a new product, building a new campaign or just collecting opinions … 3) Pay attention to shifts in opinion … or emoticons … 4) Follow trending topics. Twitter has recently added a trending topics section to its home page, showing the 10 most discussed topics at the moment …

Edit by TJS

* * * * *

Full Article
http://online.wsj.com/article/SB10001424052970204731804574391102221959582.html

* * * * *

Did you know …

January 11, 2010

From the Statistical Abstract of the United States:

  • In 2007, the average American spent 1,613 hours watching TV, the equivalent of 67 days.
  • About three-quarters of Americans (76.1 percent in 2007, to be exact) get to work by driving alone. Only 10.4 percent carpool, while 4.9 percent use public transportation and 2.8 percent walk.
  • On average, Americans spend 25.3 minutes commuting each way. The state with the longest average commuting time is New York, at 31.5 minutes.
  • In 2006, about 34 percent of U.S. adults were judged obese, triple France’s rate (10.5 percent) and four times Switzerland’s (7.7 percent).
  • From 1993 to 2007, murders dropped from 25,000 to 17,000 and robberies from 660,000 to 445,000.
  • In 2007, 18 percent of high school students reported carrying a weapon sometime in the previous year.
  • Smoking continues to decline, from 25.3 percent of adults in 1990 to 19.7 percent in 2007.
  • Garbage per person has stabilized; it was 4.5 pounds per day in 1990 and 4.6 pounds in 2007.
  • In 2007, nearly two-fifths of all U.S. births were to unmarried women, double the share in 1980.
  • The share of children under the federal poverty line in 2007 (17.6 percent) was virtually the same as in 1980 (17.9 percent).
  • Since 1970, the student-teacher ratio in schools has declined dramatically, from 22-1 to 15-1 in 2007 … with little effect on test results.
  • Almost one-quarter of elementary and high school students are immigrants or have immigrant parents.

Excerpted from RCP: American Life by the Numbers, January 11, 2010
http://www.realclearpolitics.com/articles/2010/01/11/suicide_sex_and_suvs_99842.html

Gallup: Obama Begins 2nd Year w/Highest Disapproval Rating in Modern Era

January 8, 2010

According to Gallup’s first full data set for 2010, Barack Obama starts his second year in office with the highest disapproval rating of any President since Eisenhower.

Obama begins 2010 with 44% of the public disapproving of the job he’s doing as president. That’s four points higher than the next closest president (Reagan), six points worse than Bill Clinton, and 17 points worse than Jimmy Carter.

Obama also begins his second year in office with the second worst job approval rating of any president in the last 56 years:

image

http://realclearpolitics.blogs.time.com/2010/01/06/gallup-obama-begins-2nd-year-whighest-disapproval-rating-in-modern-era/

* * * * *

How many gallons of soda do YOU drink in a year? How much time in a car each day?

January 6, 2010

Some interesting stats from WHAT AMERICANS REALLY WANT by Dr. Frank I. Luntz

* * * * *

Americans say they average of 87 minutes a day behind the wheel. For car commuters, it’s an average of 100 minutes.

More than one-third of working Americans are awake by 6:00 a.m. and out the door by 7:00 a.m.  … for a commute to work that is an hour or longer.

More than 3 million Americans travel 50 miles or more one-way to work.

Less than 5 percent of the population takes public transportation to work, and only 12 percent carpool.

About 100 million people drive alone to work each day.

* * * * *

Americans drink an average of more than 50 gallons of soda per person per year.

Put another way, people drink more soda than coffee, milk, and
fruit drinks combined.

* * * * *

Three-quarters of Americans are overweight, meaning they weigh more than the recommended weight for their height … 25 years ago, 50% were overweight.

One-third are obese, meaning they weigh at least 20 percent more than their ideal weight … that’s doubled over the past 25 years. 

Bottom line: All-you-can-eat is no longer just an occasional trip to the buffet line — it’s now a way of life.

* * * * *

From: WHAT AMERICANS REALLY WANT. . . REALLY – The Truth About Our Hopes, Dreams, and Fears
by Dr. Frank I. Luntz

The 5 things that Americans really want …

January 5, 2010

Excerpted from: WHAT AMERICANS REALLY WANT by Dr. Frank I. Luntz

* * * * *

According to Dr. Luntz, the five core attributes define what Americans really want.

1. More money.

Financial success has always been the highest priority for American men, but with the economic downturn it has leapt to the top among American women as well.

For millions of Americans approaching retirement, it’s less about more money and more about just getting back to where they once were.

For women, money is all about personal security, about having no fears and no worries of the financial kind.

Women measure success in life based on personal satisfaction and happiness — and the lack of economic anxiety leads to personal happiness.

For men, more money means more freedom, although that does manifest itself in the desire to buy more stuff. Men are much more likely than women to measure their success by their accumulation of material goods: house, car, technology, toys, the whole package.

For both men and women, money is more important today than at any time in a long time.

2. Fewer hassles.

Having fewer hassles is now the number two day-to-day priority of Americans.

Companies that sell products in shrink-wrapped hard plastic shells that are impossible to open don’t understand the importance of a hassle-free life.

Other examples are products that don’t perform like they do on television, services that sound much better in the advertisement than they are in reality, and
technologies that break or never work right in the first place.

3. More time.

Time used to be the highest priority for women — and for good reason.

From getting the kids up in the morning to paying the bills at night, women shoulder the majority of family responsibilities and household chores, even though the vast majority of women now work outside the home.

They have little time for themselves, and they crave it.

4. More choices.

There is an important distinction between choice and the right to choose.

Young people embrace as much choice as possible. Give them 15 choices of exercise equipment or 20 choices of coffee — the more the better.

Conversely, older people want the right to choose but don’t actually want to make the choice.  If you give them a choice of 20 different health-care plans, you’ve created a situation somewhere between confusion and chaos. To them, too many choices is no choice at all.

But for most Americans, limiting their choices is like denying life, liberty, and the pursuit of happiness.

If you sell the right to choose, or seem to expand people’s choices, you will find a lot of buyers.

5. No worries.

This can mean anything from “Yes, it will get done” to “I will take care of you.” It’s an expression of confidence that things will turn out right. 

* * * * *

From: WHAT AMERICANS REALLY WANT. . . REALLY – The Truth About Our Hopes, Dreams, and Fears
by Dr. Frank I. Luntz

Shoot the messenger !

January 5, 2010

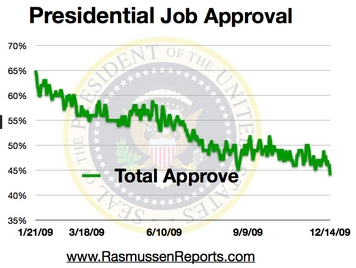
Ken’s Take: I’m a big fan of Rasmussen Reports’ polls — in part because I like the answers, but more because of its track record for accuracy.

Since Rasmussen was first to report Pres Obama’s approval slide — and continues to be less favorable than the ABC, CBS, NBC, and CNN commissioned polls — the Rasmussen Reports are under attack.

Draw your own conclusion.

* * * * *

Excerpted from Politico: Low Obama favorables: Dems rip Rasmussen Reports, January 2, 2010

Democrats are turning their fire on Scott Rasmussen, the prolific independent pollster whose surveys on elections, President Obama’s popularity and a host of other issues are surfacing in the media with increasing frequency.

The pointed attacks reflect a hardening conventional wisdom among prominent liberal bloggers and many Democrats that Rasmussen Reports polls are, at best, the result of a flawed polling model and, at worst, designed to undermine Democratic politicians and the party’s national agenda. “His data looks like it all comes out of the RNC [Republican National Committee].”

While Scott Rasmussen, the firm’s president, contends that he has no ax to grind — his bio notes that he has been “an independent pollster for more than a decade” and “has never been a campaign pollster or consultant for candidates seeking office” — his opponents on the left insist he is the hand that feeds conservative talkers a daily trove of negative numbers that provides grist for attacks on Obama and the Democratic Party.

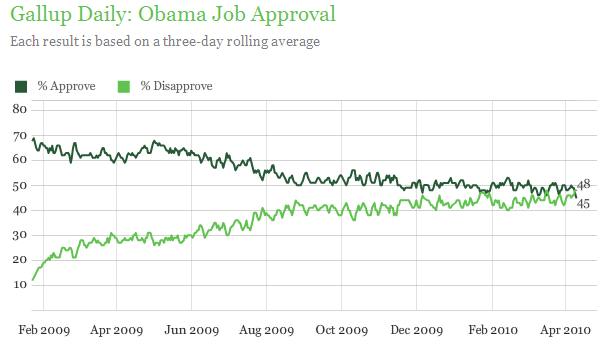
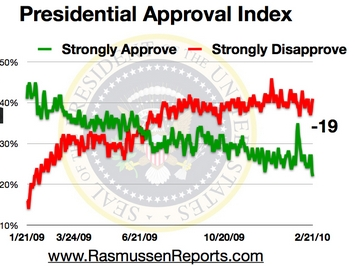
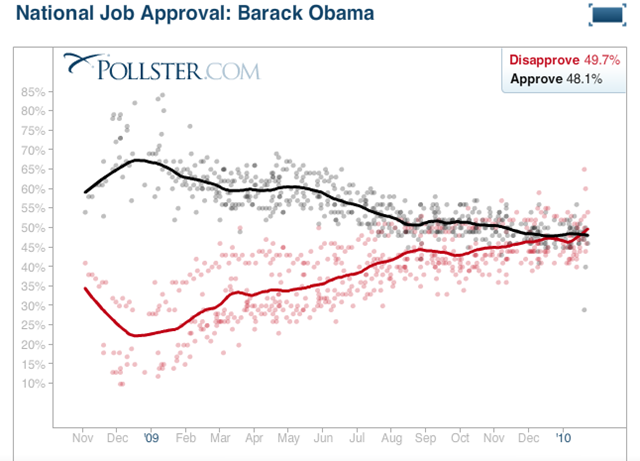
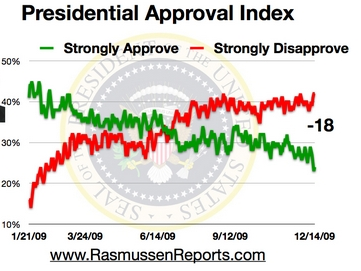
Nothing, however, sets off liberal teeth gnashing more than Rasmussen’s daily presidential tracking polls, which throughout the year have consistently placed Obama’s approval numbers around 5 percentage points lower than other polling outfits.

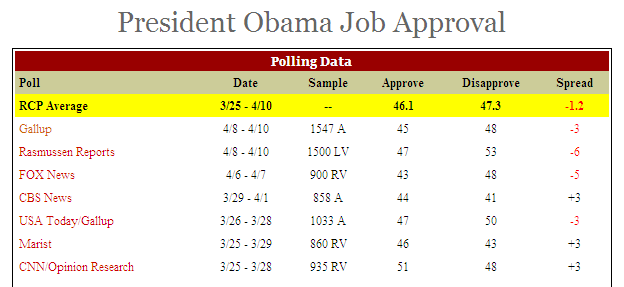
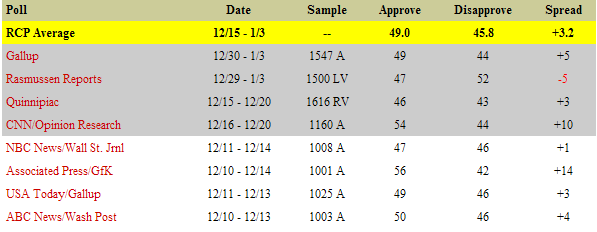
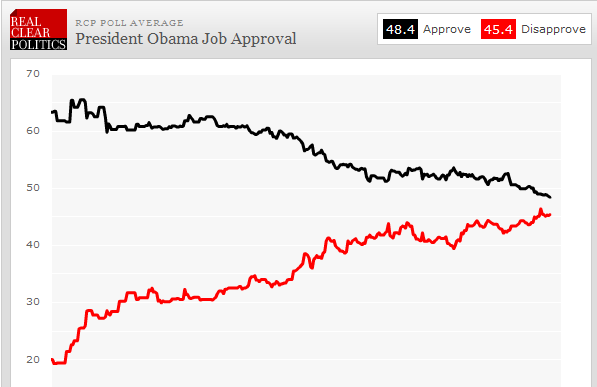
Ken’s Fact Check: The RCP Poll of Polls Data

image
http://www.realclearpolitics.com/epolls/other/president_obama_job_approval-1044.html

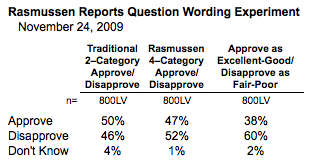
Democratic pollster Mark Mellman believes Rasmussen designs its polling questions to elicit negative responses about Obama and Democrats — a sentiment that is widely shared in the liberal blogosphere.

“I think they write their questions in a way that supports a conservative interpretation of the world … In general, they tend to be among the worst polls for Democrats, and they phrase questions in ways that elicit less support for the Democratic point of view.”

Rasmussen is quick to point out the accuracy of his surveys — noting how close his firm was to predicting the final outcome in this fall’s New Jersey governor’s race. (Rasmussen’s final survey in the race showed Republican Chris Christie edging out Gov. Jon Corzine 46 percent to 43 percent. Christie beat Corzine 48 percent to 45 percent on Election Day.)

Last year, the progressive website FiveThirtyEight.com’s pollster ratings, based on the 2008 presidential primaries, awarded Rasmussen the third-highest mark for its accuracy in predicting the outcome of the contests. And Rasmussen’s final poll of the 2008 general election — showing Obama defeating Arizona Sen. John McCain 52 percent to 46 percent — closely mirrored the election’s outcome.

Rasmussen, for his part, explained that his numbers are trending Republican simply because he is screening for only those voters most likely to head to the polls — a pool of respondents, he argues, that just so happens to bend more conservative this election cycle.

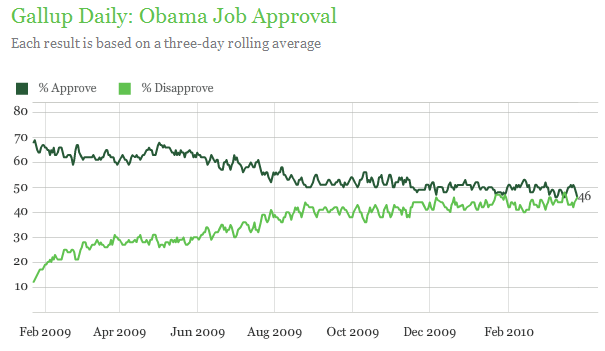
Polling all adults — a method used by Gallup, another polling firm that conducts a daily tracking poll of Obama — Rasmussen acknowledged, is “always going to yield a better result for Democrats.” But critics note that the practice of screening for only those voters regarded as most likely to head to the polls potentially weeds out younger and minority voters — who would be more likely to favor Democrats than Republicans.

Rasmussen, of course, is hardly the only pollster to come under fire this election cycle — just the one who attracts the most sustained criticism.

Last month, conservative radio host Rush Limbaugh accused the Gallup polling organization of “doing everything they can — they’re upping the sample to black Americans — to keep” Obama’s approval at 50 percent.

Full article:
http://dyn.politico.com/printstory.cfm?uuid=DCAD6DDB-18FE-70B2-A8986E439331DA11

News flash: 1 out of 3 is NOT a "consensus" … duh, it's not even a majority.

December 17, 2009

Though the WH claims broad based support for the proposed healthcare plan, the numbers just don’t seem to sync with the pronouncements.

From the newly released NBC /WSJ survey:

From what you have heard about Barack Obama’s health care plan, do you think his plan is a good idea or a bad idea?

32% Good idea
47% Bad idea
17% No opinion

http://www.pollster.com/blogs/us_national_survey_nbcwsj_1211.php

* * * * *

For the first time, less than half of Americans approved of the job President Barack Obama was doing. 

This marks a steeper first-year fall for this president than his recent predecessors, and a place in history with the worst ratings of any president at the end of his first year.
http://online.wsj.com/article/SB10001424052748704541004574600002289276662.html

50% Feel positively towards Obama in Dec., 68% in March

47% Approve of job Obama is doing, 46% Disapprove

33% Country moving in Right Direction, 55% Wrong Track

Democrats’ Blues Grow Deeper in New Poll, Dec. 17, 2009
http://online.wsj.com/article/SB126100346902694549.html 

* * * * *

Some miscellaneous results:

22% Approve of job Congress is doing,  68% Disapprove

38% Congressional rep deserves to be reelected, 49% Give new person a chance

55% Support increasing troop levels in Afghanistan, 39% Oppose

23% Global climate change has been established as a serious problem

15% Feel positively towards Tiger Woods, 42% Unfavorably

http://www.pollster.com/blogs/us_national_survey_nbcwsj_1211.php

You said you were satisfied … so why did you leave me ?

December 17, 2009

Takeaway: Many companies dedicate thoughtful efforts to understanding the voice of their customer, but few successfully convert these insights into actions.

In a back-to-basics move, some companies like Charles Schwab have abandoned their elaborate surveys and complicated research models to place the feedback responsibility on an obvious source – their front line employees.

* * * * *

Excerpt from Harvard Business Review, “Closing the Customer Feedback Loop,” by Rob Markey, Fred Reichheld, Andreas Dullweber, December 1, 2009.

When Charles Schwab came out of retirement to retake the helm of his firm in 2004, the business was struggling. “We had lost our connection with our clients, and that had to change,” he confessed to shareholders in the annual report. Schwab responded by implementing a new customer feedback system to reestablish the connection with his customers. In 2008, the firm saw its revenues increase by 11% and the scores that customers gave the company jump by 25%. During a time when the financial services industry was being rocked by turbulence, Schwab clients entrusted $113 billion in net new assets to the firm, and the number of new brokerage accounts increased by 10%.

Every day, managers at each of Schwab’s 306 branch offices and five call centers call customers who gave their site a low service rating. Schwab credits this outreach program as an integral part of the company’s new focus on direct customer feedback that was responsible for turning around the company.

Most companies devote a lot of energy to listening to the voice of the customer, but few of them are very happy with the outcome of the effort. Elaborate satisfaction surveys that involve proprietary research models can be expensive to conduct and slow to yield findings. Once delivered, their findings can be difficult to convert into practical actions. Additionally, most customers who end up defecting to another business have declared themselves “satisfied” or “very satisfied” in such surveys not long before jumping ship.

Instead of building elaborate, centralized customer research mechanisms, some firms begin their feedback loop at the front line. Employees working there receive evaluations of their performance from the people best able to render an appraisal—the customers they just served. The employees then follow up with willing customers through one-on-one conversations. The objective is to understand in detail what the customers value and what the front line can do to deliver it better. Over time, companies compile the data into a baseline of the customer experience, which they draw upon to make process and policy refinements.

The strongest feedback loops do more than just connect customers, the front line, and a few decision makers in management. They keep the customer front and center across the entire organization. One approach that works well across a range of industries is the Net Promoter Score (NPS), which immediately categorizes all customers into one of three groups—promoters, passives, and detractors. This allows employees throughout a company to see right away whether a customer experience was a success or a failure, and why.

NPS is generated by asking customers a single question, “How likely would you be to recommend this company or product to a friend or a colleague?” Respondents giving marks of 9 or 10 are promoters, the company’s most devoted customers. Those scoring their experience 7 or 8 are passives, and those scoring it from 0 to 6 are detractors. NPS is the percentage of promoters minus the percentage of detractors. Customers are then asked to describe why they would be likely or unlikely to recommend the company. The insights gathered from their answers enable employees to quickly identify issues that create detractors, and the actions required to address them.

Edit by BHC

* * * * *

Full Article
http://hbr.harvardbusiness.org/2009/12/closing-the-customer-feedback-loop/ar/1

* * * * *

Why I don’t let students grade themselves …

December 15, 2009

Under tough interrogation by Oprah, President Obama scored his job performance at B+ … A- if the healthcare monstrosity gets passed.

Doing pretty good, right ?

Well, not according to the most recent polls.

* * * * *

The most recent RealClearPolitics  poll of polls has only 48.4% of Americans approving of the job Obama is doing. 

image http://www.realclearpolitics.com/epolls/other/president_obama_job_approval-1044.html

* * * * *

The most recent Rasmussen survey  — which leans a bit right and tends to lead the other polls — has only 44% of likely voters approving of Obama’s job performance.

image
http://www.rasmussenreports.com/public_content/politics/obama_administration/daily_presidential_tracking_poll

* * * * *

And, on what I believe to be the most indicative measure — Rasmussen says that only 24% strongly approve of Obama’s performance, while 42% strongly disapprove.  A deficit gap of 18 points.

image
http://www.rasmussenreports.com/public_content/politics/obama_administration/daily_presidential_tracking_poll

It’s how you ask the question …

December 9, 2009

Another great analysis from Pollster.com.

Focus is on Presidental Approval Ratings, but the findings are generalizable to other surveys, e.g. customer satisfaction.

* * * * *

From Pollster.com:

Most pollsters offer just two answer categories: “Do you approve or disapprove of the way Barack Obama is handling his job as president?”

Rasmussen’s question prompts for four: “How would you rate the job Barack Obama has been doing as President … do you strongly approve, somewhat approve, somewhat disapprove, or strongly disapprove of the job he’s been doing?”

Rasmussen has long asserted that the additional “somewhat” approve or disapprove options coax some respondents to provide an answer that might otherwise end up in the “don’t know” category.

Rasmussen conducted an experiment to test that argument.

They administered three separate surveys of 800 “likely voters, each involving a different version of the Obama job approval rating: (1) the traditional two category, approve or disapprove choice, (2) the standard Rasmussen four-category version and (3) a variant used by Zogby and Harris, that asks if the president is doing an excellent, good, fair or poor job.

The table below collapses the results into two categories; excellent and good combine to represent “approve,” fair and poor combine to represent “disapprove.”

image

In general, smaller don’t know percentages tend to translate into larger disapproval percentages. The 4-category Rasmussen version shows a smaller “don’t know” (1% vs. 4%) and a much bigger disapprove percentage (52% vs 46%) compared to the standard 2-category question.

The approve percentage is only three points lower on the Rasmussen version (47%) than the traditional question (50%).

The Rasmussen experiment shows an even bigger discrepancy between the approve percentage on the two-category questions (50%) and the much lower percentage obtained by combining excellent and good (38%).

* * * * *

Generalizing the findings: To increase “data discrimination” when doing customer sat polling, use 4 categories and and focus on the “very” categories at the extremes.  That’s where the real info is …