Archive for April 16th, 2020

What’s your Body Mass Index?

April 16, 2020

It’s a predictor of severe Covid-19 symptoms!
============

A couple of weeks ago, I heard a couple of frontline docs observe than many of the most severe Covid-19 patients were overweight.

body mass index for adults

Just an anecdote, but I stored it away as a clue.

Well, turns out that there’s data supporting the docs’ anecdotal evidence…

(more…)

Let’s play “Are you ready to”

April 16, 2020

OK, relatively soon, the economy will be re-opened … though, I’m not exactly sure what that means.

image

Here’s the rub…

Just because some activity is allowed to open, doesn’t mean that the public will be partaking.

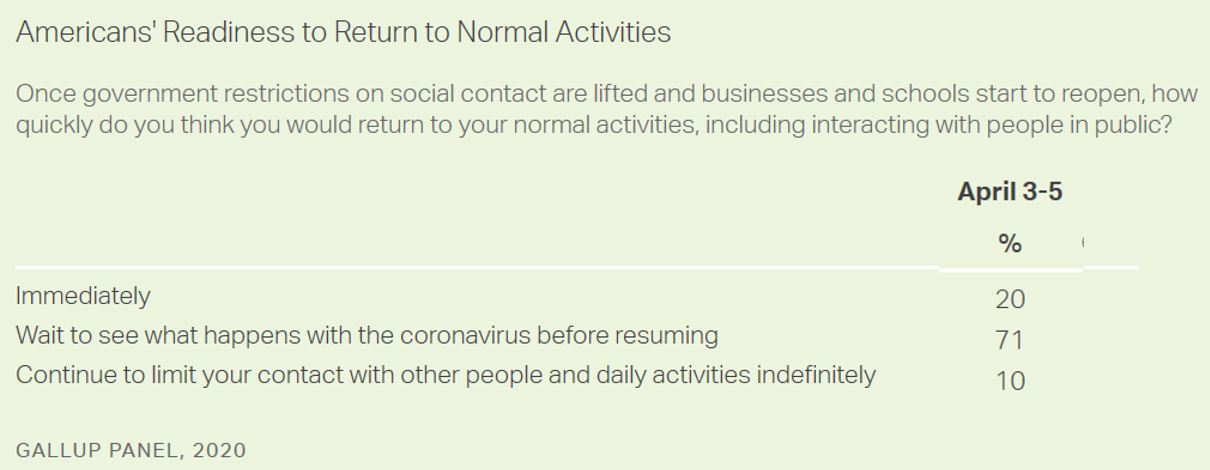
Based on a recent Gallup poll, the vast majority (70%) say they plan to take a “wait & see” approach to resuming activities.

That makes sense, and the poll is directionally indicative, but decisions will likely relate to specific activities.

So, let’s play “Are You Ready To”….


=================


For example, when the economy opens, will you be ready to…

  • Take a bus or subway?
  • Ride with others in an elevator?
  • Work in an open space office?
  • Meet with colleagues at work?
  • Participate in conference room meetings?
    =============
  • Take a plane flight?
  • Take a cruise?
  • Stay in a hotel?
  • Go to a vacation resort?
    =============
  • Go to church?
  • Dine in at a restaurant?
  • Go to the gym to workout?
  • Shop at a discount or department store?
  • Attend a class with 30 other students?
  • Go to a big crowd sporting event?
  • Go to a movie or a play?
  • Get a haircut?

You get the idea…

What other activities should be on the list?

==============
Thanks to MC for feeding this idea.

April 16: C-19 UPDATE

April 16, 2020

KEY CHART: Daily New Deaths

2,490 Daily New Deaths Worldometer
Level from prior day  

1,103 in NY+NJ+CT   46% of Total US
DOWN slightly from prior day 

image

Cumulative U.S. Deaths 
28,554 
Worldometer
30,985 
JHU

Note: NYC added 3,700 “presumed” covid cases.  It appears that JHU has added (some of) those deaths to their numbers, but that Worldometer has not (to preserve continuity with prior data).  We’re trying to unscramble the impact on the historical comparisons.  For now, we’re just going with the Worldometer data.

image

IHME Model Cumulative US Death Projection:
68,841 by Aug. 4  Rev. UP 8,436 on 4/13

=============

STATE DEATHS  Worldometer

Summary

  • NY+NJ+CT = 15,610  55% of US Total
       NY+NJ+CT = 10% U.S. Population
  • Top 12 Total = 24,115 85% of US Total
      Top 12 Average = 151 Deaths per Million
      Top 12 = 48% of U.S. Population
  • MD 349 Total Deaths  +47 DNDs

State-by-State Data – Top 12

(more…)